
Some charts I am looking at now – June 16
There are a few charts that really have my attention right now — although that does not necessarily mean I have a position or will enter a position in these markets. It does mean that I have a position or am looking at strategies to establish a position in these markets.
First, Crude Oil. I have commented several times in recent weeks via this blog or on Chart.ly on the recent consolidation zone. It now appears as though a descending triangle is being completed. Look for confirmation, but be aware that a bear trap could also occur. This is one of those patterns that could provide a head fake to the downside but provide big profits on the upside. But for now, I am short in my proprietary account with relatively tight stops.

Next, I will focus on one of the best potential chart set ups I have seen in a year or so — Natural Gas. The January 2012 contract displays a classic H&S bottom on both the daily and weekly charts. A major bottom is being constructed in this market. I am sure I will comment many times on this pattern and the trading implications in futures and ETFs. [Note: Dan Chesler, an excellent energy market analyst, brought this chart to my attention. Dan’s web site is www.chesler.us]


Next, Copper. I have been bearish on this chart for weeks, but the market is making it hard for position traders who sell weakness. Yet, the market is rolling over. What appeared to be a bear flag has now turned into an awkward 5-week continuation H&S pattern. If the trend has really turned down prices could easily drop $1 per pound in two months.

Next, Soybean Oil. I have had an upward bias in this market based on a possible continuation inverted H&S pattern. However, a sharp drop would complete a H&S failure sell signal. Also, the closing price chart (and I am paying more attention to closing price charts because of increased market “noise”) has completed a symmetrical triangle top. I am presently short Bean Oil, but I will remain flexible.


Next, July Chicago Wheat. If there ever was a H&S top pattern for the books, this is it. The problem is that H&S tops are supposed to occur after a large move up (i.e., tops are supposed to reverse a previous trend). This pattern does not qualify for this criteria in that the pattern itself WAS the move up. Nevertheless, this is a facinating chart worthy of following. I may or may not go short Wheat.

Next, July Silver. This market is in a major bear trend. The daily chart completed a H&S failure pattern on June 13 when the June 3 low was penetrated. I want to make a MAJOR point here, folks. I trade based on set-ups, knowing that 60% of my set-ups will fail over an extended period of time (over shorter time frames in the past, up to 80% of my signals have failed to produce profitable trades). I comment on set-ups, not on market opinions.
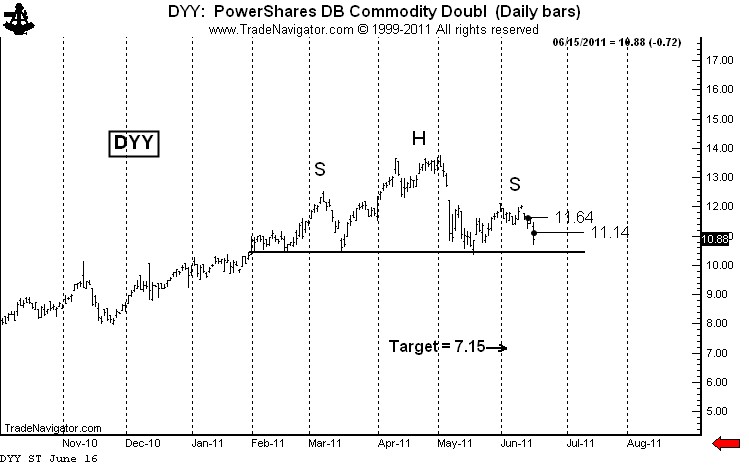
Finally, DYY (the ultra long commodity ETF). I am engaged in a short-selling campaign in this ETF. See previous posts here and here. I will pursue the strategy I have already disclosed. I am short two layers of DYY and will short a third layer if the H&S top is completed.

That’s all for now, folks.
Symbols related to this post: $ZW_F $DYY $NG_F $ZL_F $SI_F $SLV $CL_F $DJP $SIVR $GAZ $DBA $UNG
Disclaimer: I am a pure chartist. I do not trade based on fundamental or macro-economic factors.
###

Leave a Reply
Want to join the discussion?Feel free to contribute!