It’s 1…2…3 strikes you’re out!
The S&Ps have a possible top
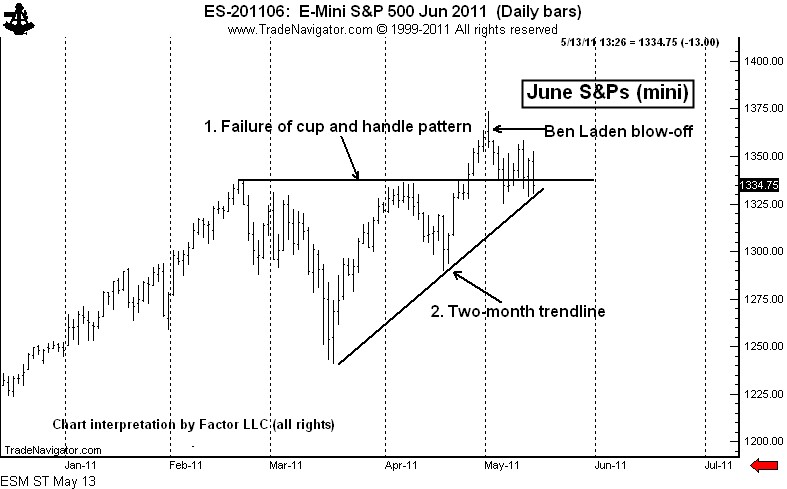
When it comes to classical charting, it is always best when a multiplicity of developments occur. Such is the case in the S&P right now. There are three (if not four) chart developments that could support an important change in trend.
FIrst, the late April breakout from the 9-week cup and handle pattern has not resulted in follow through. The top of this pattern was tested hard on May 5. A move below the May 5 low would be a failure of this pattern. Possible strike 1.
Second, the daily chart displays a trendline from the March low. While I am not a big fan of trendlines, when a trendline violation occurs simultaneously with other developments it grabs my attention. Possible strike 2.
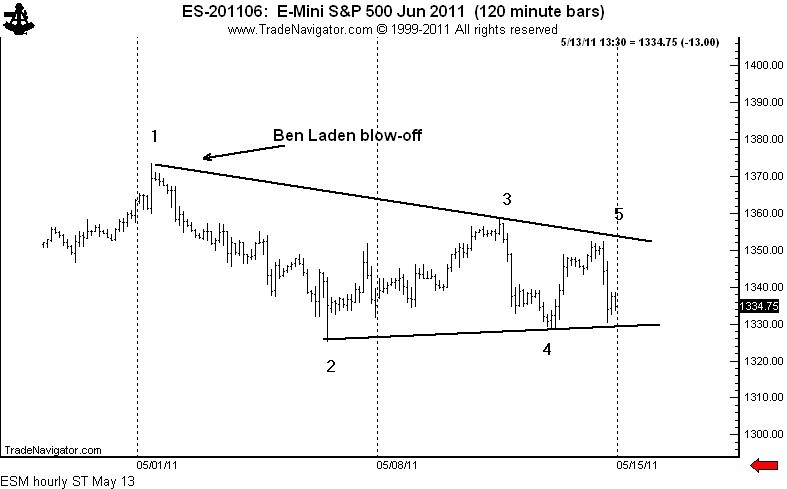
Third, the intraday chart displays a clearly defined 5-point symmetrical triangle top. Possible strike 3.
Importantly, a decline below the May 5 low would complete all three developments. There is one other important technical factor worthy of note. The Ben Laden top now appears to be a clear blow-off. The market has been unable to trend back into the range of this reversal day.
I will short this market if the May 5 low is penetrated. The target would be 1243. I remain long the Nasdaq from April 20– and am very close to being stopped out of that trade.
###


Leave a Reply
Want to join the discussion?Feel free to contribute!