
Apple and a history of head and shoulder patterns
The H&S pattern has served an important role in the turning points of $AAPL in recent years
The H&S pattern — when properly identified — is the most reliable of all classical chart patterns. Unfortunately novice market analysts are way to quick to mislabel market action as a H&S configuration.
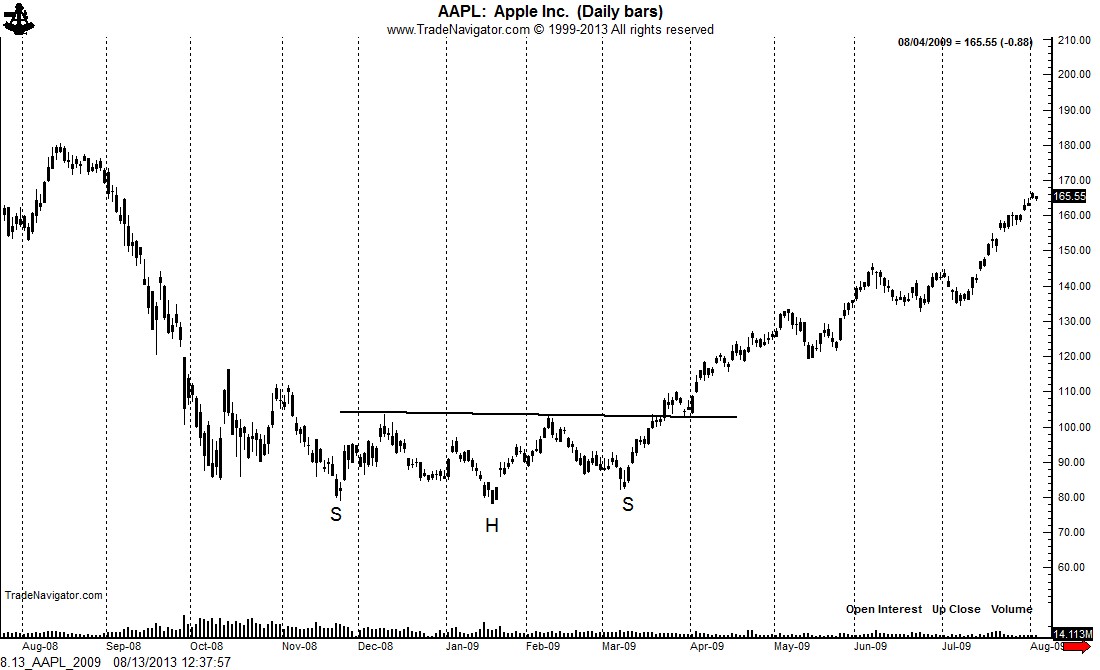
The H&S pattern has served as the key turning point in $AAPL since the March 2009 low. The first chart below shows the classic H&S bottom completed in March 2009. This pattern launched a $600 rally.
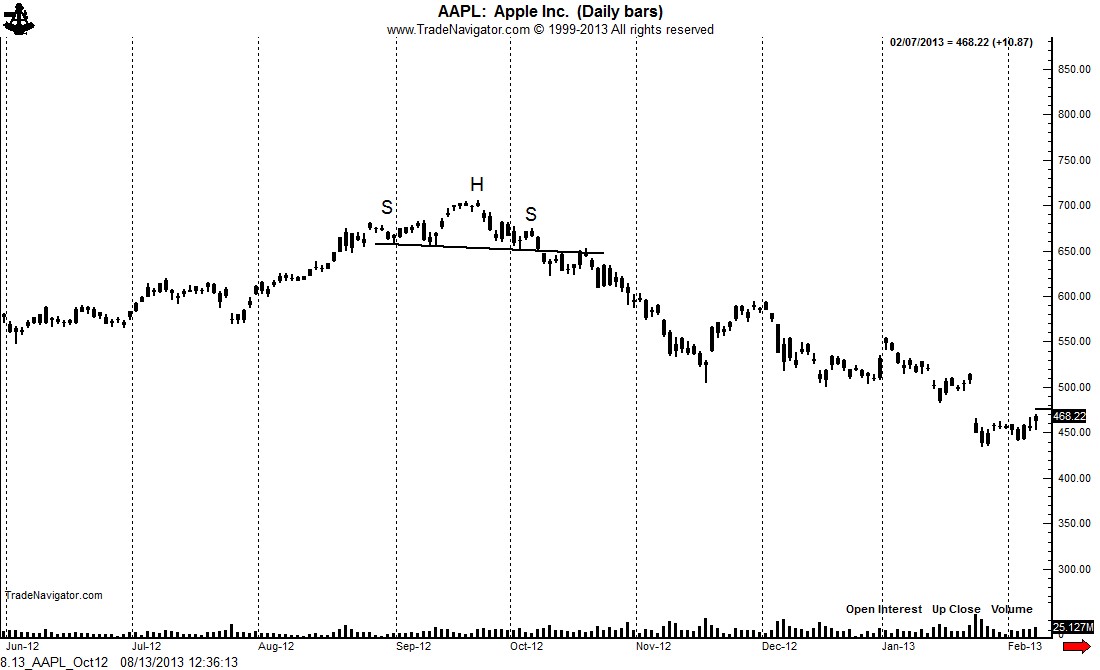
The late 2012 top took the form of a small H&S top. It is not unusual for H&S tops to be brief, whereas H&S bottom patterns tend to be much longer in duration.
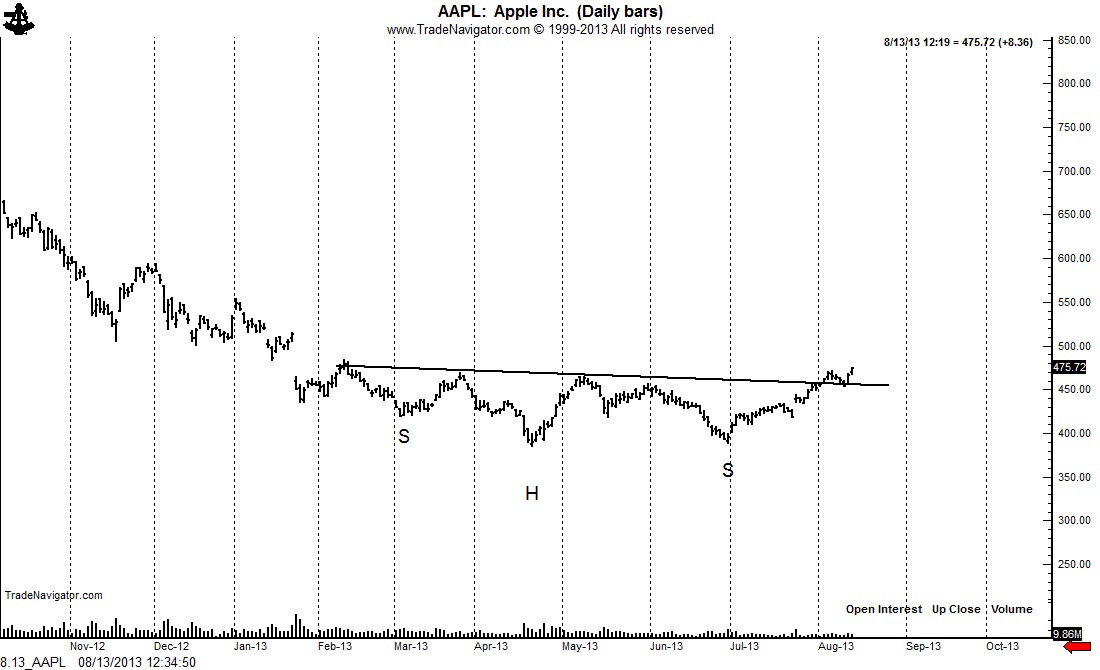
The rally in AAPL today confirmed a 6-month H&S bottom. It appears as though the long-term bull trend in AAPL has re-emerged. The intial target of this pattern is $545. A close below $425 would negate this interpretation.
$AAPL
###

Leave a Reply
Want to join the discussion?Feel free to contribute!