Tag Archive for: HG_F
Charts I am watching, week of April 2, 2012
/by Peter BrandtCopper, stopper, build a topper?
/by Peter BrandtCopper: A case study of a difficult breakout
/by Peter BrandtBreakouts from patterns are not always clean and can cause tactical problems with entry and sizing. In fact, it is often the case that a trader can lose money trading a difficult breakout even if the market proves the trader right.
Copper is a great case study.
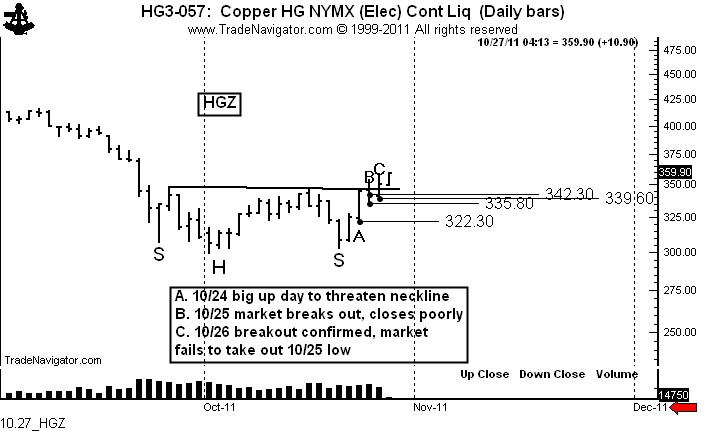
On Oct. 20 and 21 it was apparent that Copper was forming a possible H&S bottom with an extended right shoulder (meaning that the right shoulder low was futher from the head low than was the left shoulder low).
Marked “A,” the strong advance on Oct. 24 was a good indication that this pattern was a real possibility, even though the market did not penetrated the neckline. The Oct. 24 low was 322.30.
Marked “B,” on Oct. 25 the market penetrated the neckline, but closed weak. The H&S bottom was not completed on a closing basis. However, increasingly breakout days that close back within a pattern can be used as the basis for a protective stop. A purchase at unchanged or lower on Oct. 26 could have used the Oct. 25 low as a stop-out point.
A characteristic of a valid upside breakout is that a series of higher highs occur even if the breakout is sloppy.
Marked “C,” the market finally confirmed the H&S bottom with the close on Oct. 26. However, buying the close on this date at about 351 would carry a risk to below the same day’s low at 339.60.
Let me move this case now to address position sizing. I am a believer that risk should be limited to no more than 100 basis points, or 1% of the total size of a trading account (or composite of accounts). This means that a long taken on the confirming close on Oct. 26 had a risk of approximately $3,000 per contract.
Under my risk rules, and using a stop that makes technical sense and is not just an arbitrary dollar amount, $300,000 would be the minimum sized account that could have bought Copper on Oct. 26.
Copper has an upside target of around 396.
$HG_F
###
Three very sexy price charts
/by Peter BrandtCopper bear market continues to unfold
/by Peter BrandtSilver is also setting up for a sell signal.
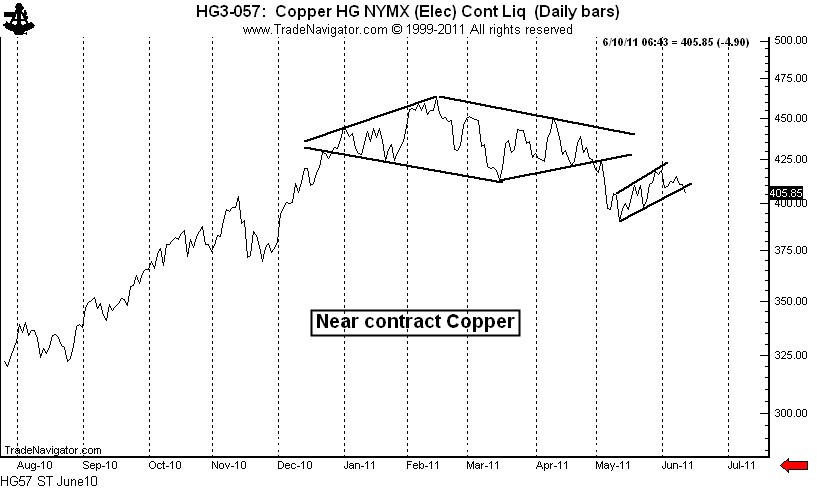
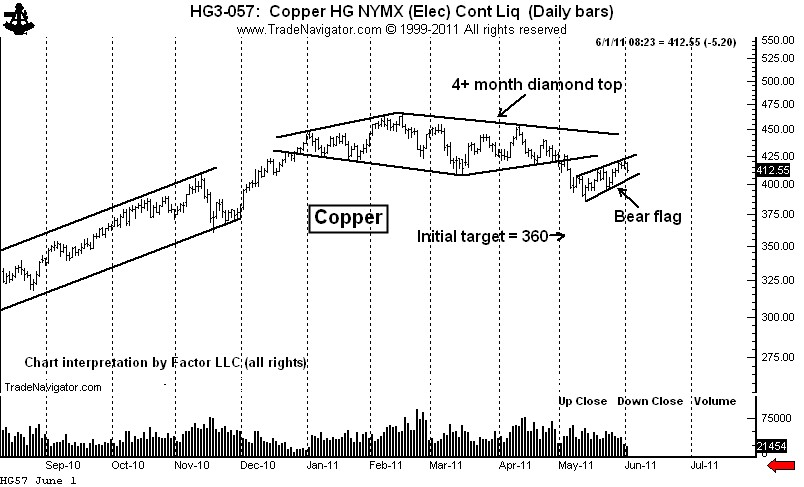
I last commented on Copper in a June 1 post titled, “Major chart top in Copper – Target is 360.” The bear flag identified in that post appears poised for completion. A move and close below the June 2 low of 403.25 (July contract) would put the finishing touches on the red metal. The chart below is a closing price chart — the close-only flag would be completed today by a close below 408. Such a close would have initial targets of the May 12 low at 385.35 and the November low at 360 to 365. The diamond top projects to 363.
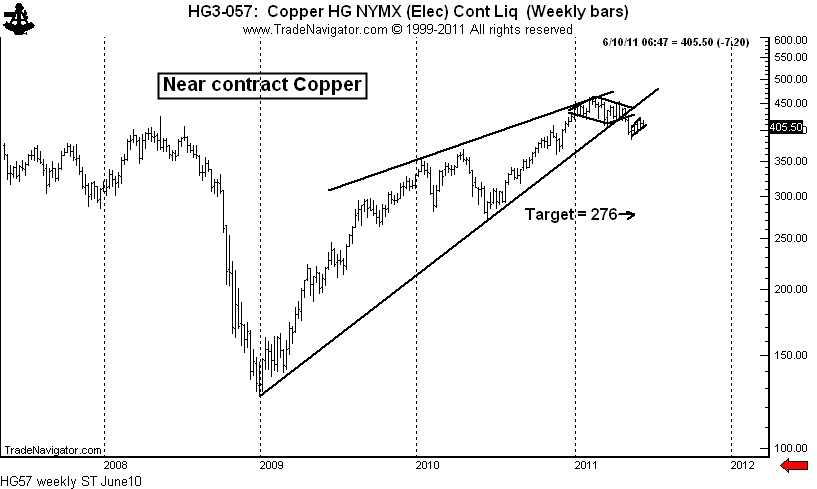
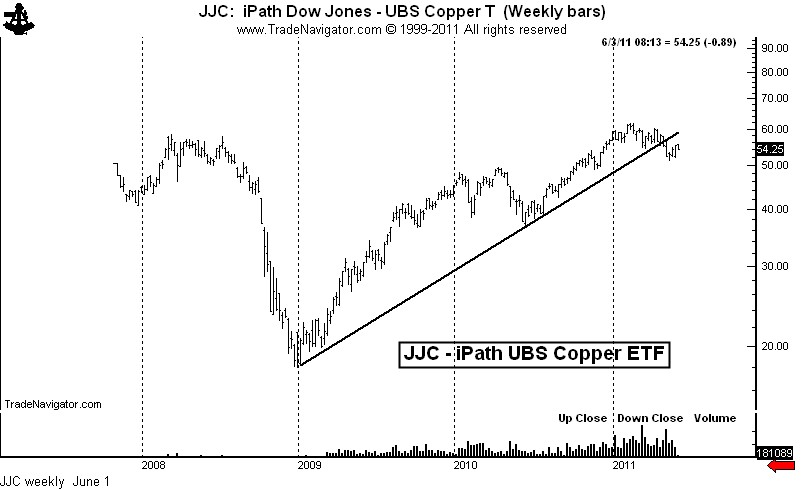
In my opinion, if Copper has really rolled over (if the bull trend from the December 2008 low has run its course), the most likely target for a bear thrust on the weekly chart is the 2010 low at around 276. The bull trendline on the weekly log chart has been penetrated. Keep in mind that the violation of a trendline is not a signal in my trading, but simply indicates a change in a market’s behavior.
Selling Copper on weakness has not been a profitable manuever. If the flag is confirmed, Copper should be shorted on 700 to 800 point rallies.
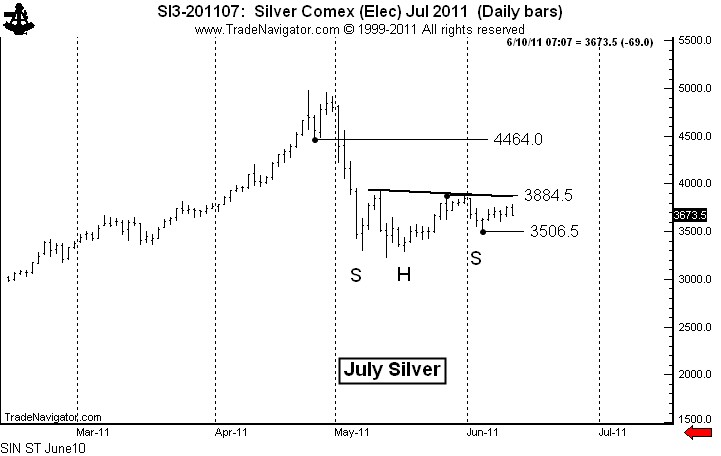
A postnote on Silver. This market is setup to signal a H&S failure. I will short Silver if the June 3 low at 3506 is penetrated, risking about 50 basis points.
###
Major chart top in Copper — target is 350
/by Peter BrandtBear flag retest of diamond top is turning down
Two chart observations are worthy of note on the nearby daily futures graph. First, the decline in early May completed a 4+ month diamond top. This is a major reversal pattern. Second, the rally from the May 12 low is tracing out a bear flag. The decline today may indicate that the May 31 high will be the high of the flag.
The weekly chart of JJC, the Copper ETF, shows that the dominant trendline from the late 2008 bottom has been violated. Keep in mind, the violation of a bull trendline is not, in and of itself, a bearish signal. It does recognize that a trend change is in the process of developing.
###
Recent Posts:
 Primer: Interest Rates & The Fed (+FREE .PDF)December 3, 2025 - 8:30 pm
 Loss Aversion: A Mental Trap Every Trader Needs to KnowNovember 19, 2025 - 6:52 pm
 Three Day Trailing Stop (Video)October 24, 2025 - 5:25 pm
 One Year Later: GE, Classical Charting, and Avoiding Dead MoneyJuly 22, 2025 - 1:01 pm

