Tag Archive for: AAPL
Apple and a history of head and shoulder patterns
/by Peter Brandt
The H&S pattern has served an important role in the turning points of $AAPL in recent years
The H&S pattern — when properly identified — is the most reliable of all classical chart patterns. Unfortunately novice market analysts are way to quick to mislabel market action as a H&S configuration.
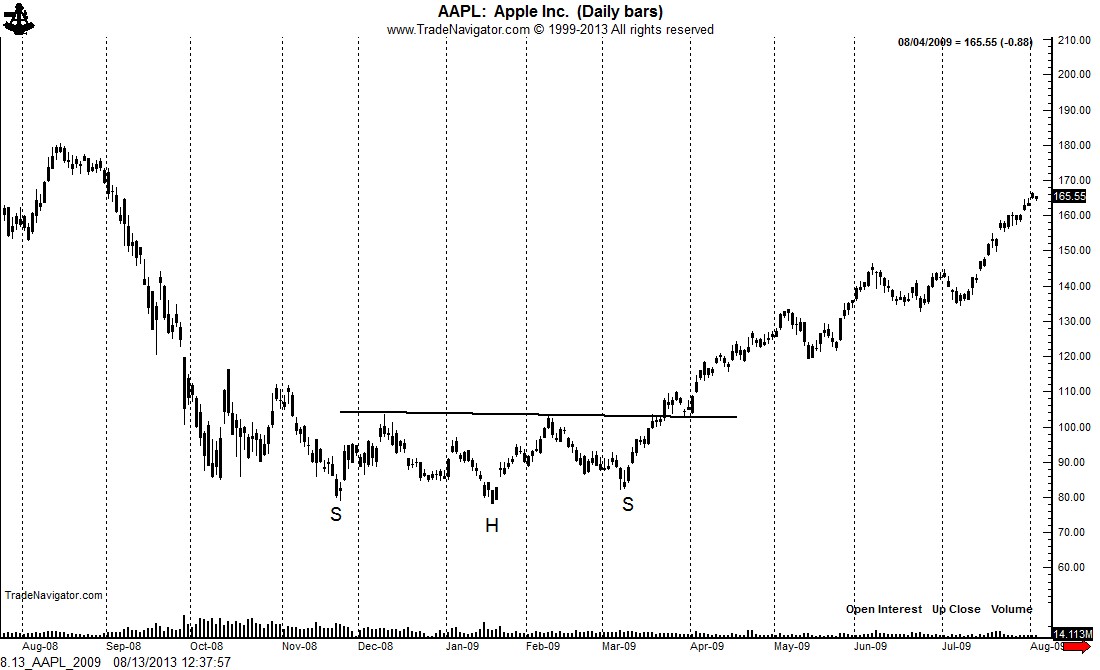
The H&S pattern has served as the key turning point in $AAPL since the March 2009 low. The first chart below shows the classic H&S bottom completed in March 2009. This pattern launched a $600 rally.
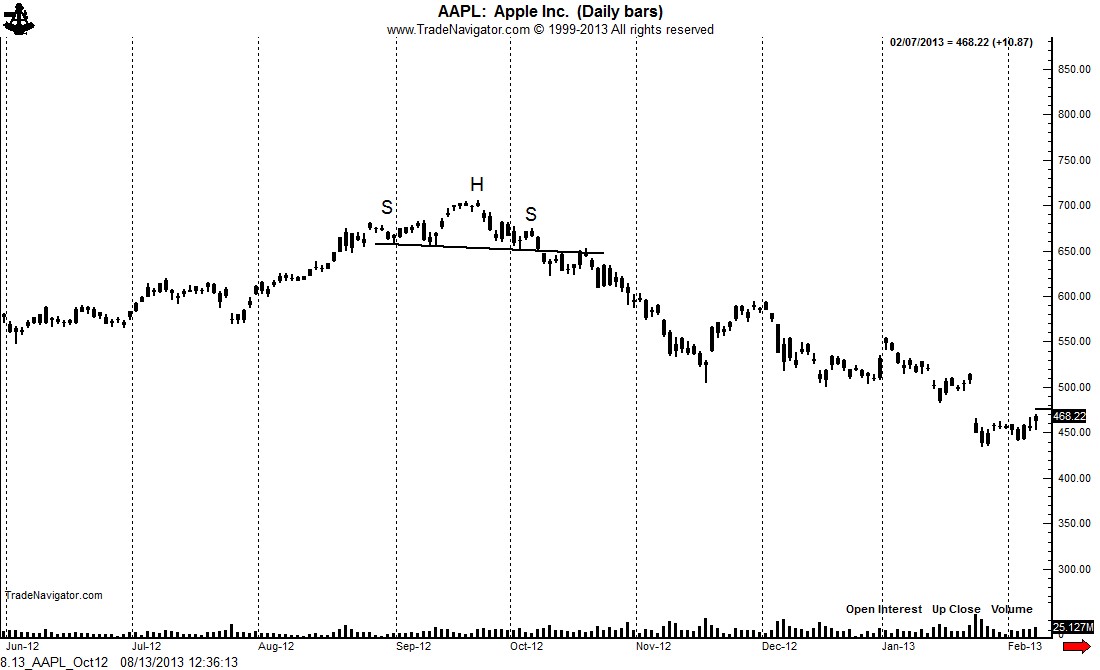
The late 2012 top took the form of a small H&S top. It is not unusual for H&S tops to be brief, whereas H&S bottom patterns tend to be much longer in duration.
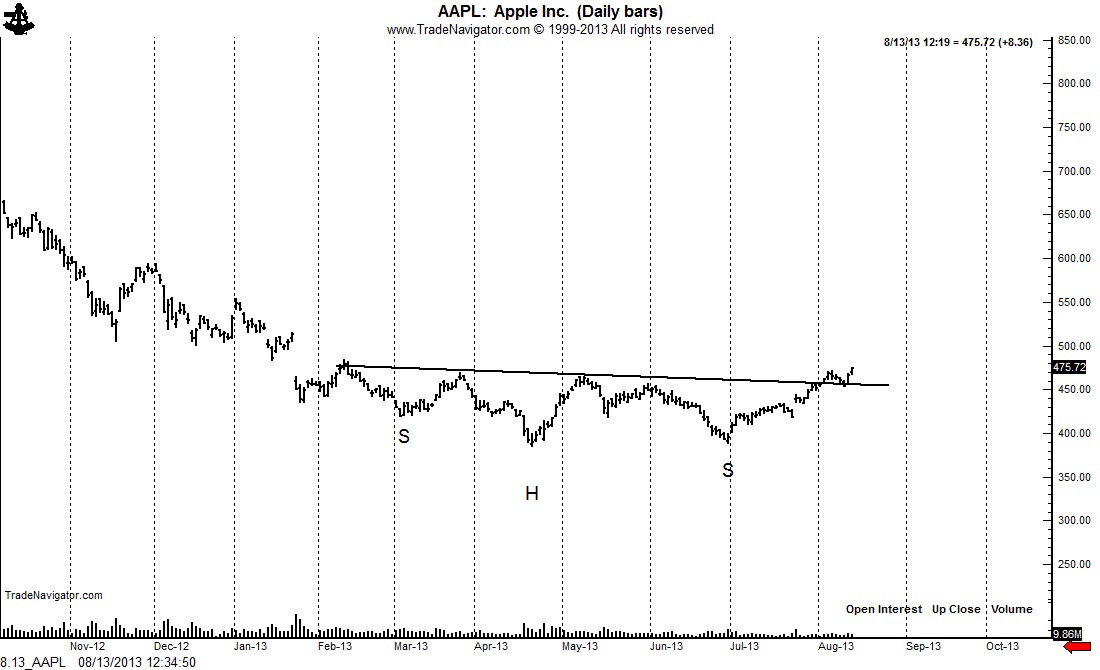
The rally in AAPL today confirmed a 6-month H&S bottom. It appears as though the long-term bull trend in AAPL has re-emerged. The intial target of this pattern is $545. A close below $425 would negate this interpretation.
$AAPL
###
A chart update on the metals, other markets
/by Peter BrandtThe Apple (AAPL) is falling from the tree
/by Peter BrandtHow I determine risk, leverage and sizing in a trade.
/by Peter BrandtThe difference between a market opinion and trading
/by Peter BrandtUp, Up and Away — U.S. Stock Market
/by Peter BrandtI’ve never liked the taste of Humble Pie!
/by Peter BrandtAKA, when I short AAPL pie, I need to prepare to eat HMBL pie
A number of readers have asked me to recap my recent trades in Apple Computer. Of course, I was a busy little beaver posting the details of my shorting campaign – mainly motivated by all the hate messages I received from my initial AAPL posting, then the post that laid out a trading strategy to risk 75 basis points (3/4 of 1%) to make 1420 basis points (14.2%).
I detailed my trading in AAPL during the course of six blog posts and 15 StockTwit posts. See the chart for the graphic representation of my trading. The sales are circled.
So, here is how my AAPL trade unfolded.
- Sold 100 shares on 4/8 at 338
- Sold 100 shares on 4/8 at 334.90
- Bot 100 shares on 4/12 at 332.02
- Sold 100 shares on 4/14 at 332.41
- Sold 100 shares on 4/18 at 322.87
- Bot 100 shares on 4/18 at 328.34
- Bot 100 shares on 4/18 at 331.81
- Bot 100 shares on 4/18 at 331.82
Bottom line:
- I planned and executed a short play in AAPL
- AAPL ended up springing a gigantic bear trap
- I ended up shorting and covering 400 shares per $100,000 of capital
- My net gain was 42 basis points (4/10th of 1%)
- The bulls won out in the end (or so it seems as of today)
Lessons:
- The AAPL lovers appear to be right after all – congrats. A trader needs to be a good loser to be a good winner
- Trading is all about risk and trade management
- Without hesitation, I would do the short campaign all over again in any other market that displayed the same chart construction
###
Thank God I’m a trader, not an analyst!
/by Peter BrandtThank God I’m a trader, not an analyst!
There is a huge difference between being a trader and being a market analyst.
Analysts are paid by being right. On this basis alone I am not smart enough to be an analyst. Traders are paid by managing risk. These two skill sets are a world apart. In my experience, people who try to be traders by being analysts usually lose their grip at both ends of the rope.
An analyst will be judged negatively by poor market calls. When wrong, a trader closes the trade and moves onto the next opportunity. Hopefully, little harm done! Being wrong is a fundamental assumption for a trader.
Analysts study industries, companies and economic conditions. Traders, at least most traders, study price and could care less what company the price represents.
Analysts – even technical analysts – become heavily vested in the rightness of their opinions. Analysts gain reputational equity based on their correct calls. Traders become economically vested by what they do with their losing trades. Traders gain capital equity based on their handling of losing calls.
When an analyst changes an opinion on a stock or the general market, it is called a “revised forecast due to changing fundamentals.” When a trader changes an opinion on a trade, it is called “flexibility for capital preservation and survival.”
I am a classical chartist. I view charts as a trading tool, not a method to forecast prices. I don’t believe charts can forecast prices. I have a disdain for “chart book economists.” I do believe that charts can provide unique high potential/low risk trading opportunities. To me, that is the only real value of charts. The idea of forming some grand economic scenario based on a chart is absolutely ludicrous.
The reality is that most chart formations fail to deliver the goods, especially chart patterns of shorter durations. This is why so many novice traders give up on charting, claiming that charts don’t work.
Chart patterns fail and morph into new and larger chart patterns, which morph again and again and again. I term this process “chart redefinition.” All massive chart patterns of six to 12 months in duration are made up of dozens of short-term daily patterns and hundreds of intra-day patterns that mostly failed.
Eventually a chart pattern will mature and provide a grand speculative opportunity. It is this type of opportunity that I seek. But along the way I am wrong on 65% of my trades. During some shorter-term periods of time that figure can be as high as 80%.
This is why I look for particular chart set-ups that offer a reward to risk relationship of 10 to 1, or 20 to 1, or even as high as a stage in a recent trade I made in Apple Computer, 70 to 1. I am not sure what the price of AAPL will do in the days and weeks ahead, but if refuse to take a trade with this type of reward to risk relationship I need to be put out to pasture.
One of the mental hurdles a novice trader must get past is the connection between being right on a market and making money in a trading operation. The two are disconnected. It is hard to explain this concept to a non-combatant, but all front-line soldiers reading this blog posting know exactly what I am talking about.
Trading is not for you if you have some pride of ownership in forecasting prices. If this is you, find a diet not consisting of buy and sell orders. Heck, perhaps you can find a job as an analyst.
###
The Apple has fallen (AAPL Part 6): 04.18.2011
/by Peter BrandtThe Apple has fallen…look out below!
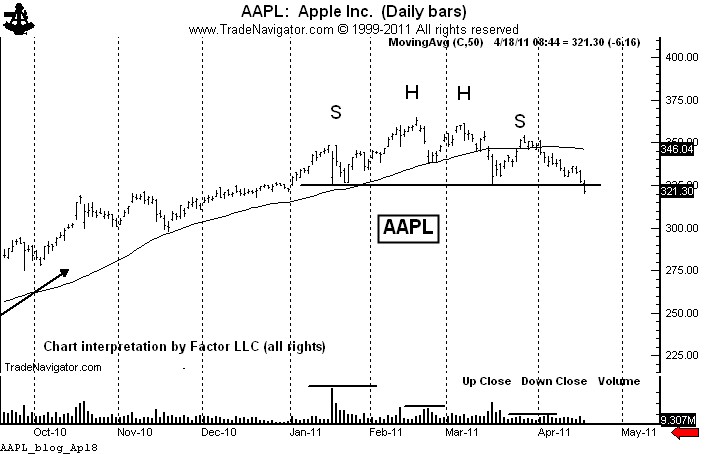
The decline by Apple today has completed a major reversal head and shoulders pattern. In the process I have now sold the final 1/3 (another 100 shares per $100,000 of capital) of my short campaign.
A close above today’s high at 328.14 and especially above the Apr. 13 high at 336.14 are required to negate the bearish interpretation of this daily chart. A close below 322 would confirm the top and establish an objective of 280. Retests of the neckline at 325 to 326 are probable, but the neckline should offer significant resistance.
As detailed by earlier blog postings and communications on StockTwits, my position is now short 300 shares per $100,000 of capital (100 at 338, 100 at 332.41 and 100 at 322.88). I am risking 100 shares to 328.32 and 200 shares to 333.41. So, my risk on the entire short position is 20 to 25 basis points. My potential gain is 1500+ basis points. This trade now has a reward/risk ratio in excess of 70 to 1.
###

