
2019 Best Dressed List – Public
Each year I publish the Best Dressed List showcasing the best examples of classical charting principles from the just-completed year.
2019 Best Dressed ListThe Public Blog site
Each year I publish the Best Dressed List showcasing the best examples of classical charting principles from the just-completed year.
2019 Best Dressed List
(This is a short excerpt from the past weekend premium member report published Friday the 7th)
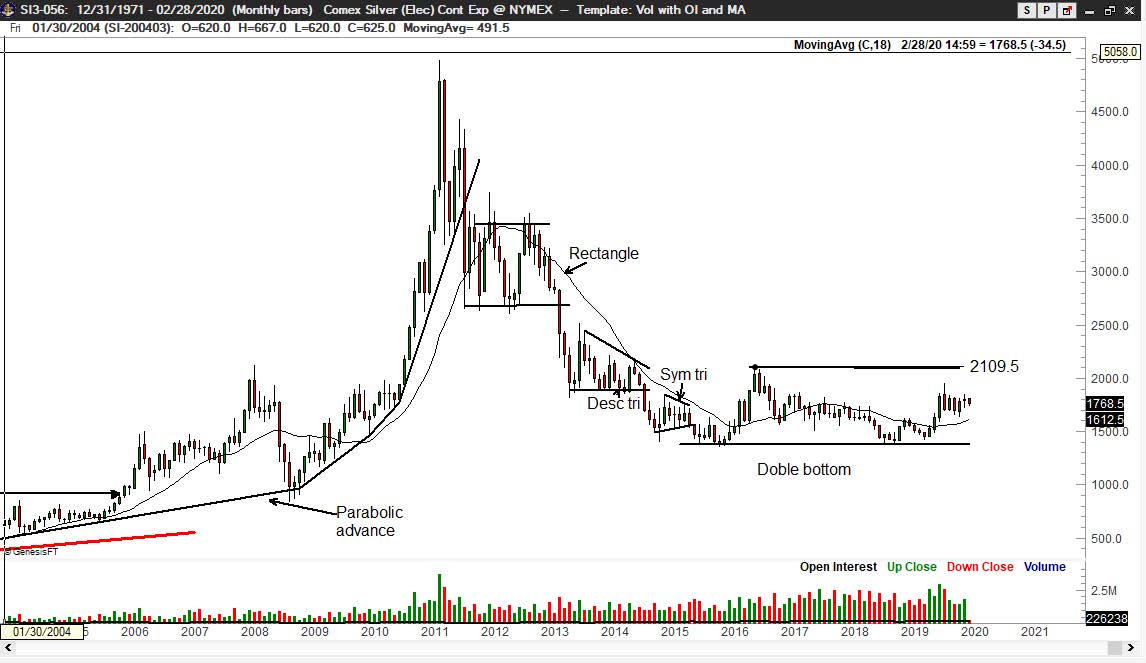
Silver is forming a broad-based double bottom. I am monitoring the daily charts for a buying opportunity.
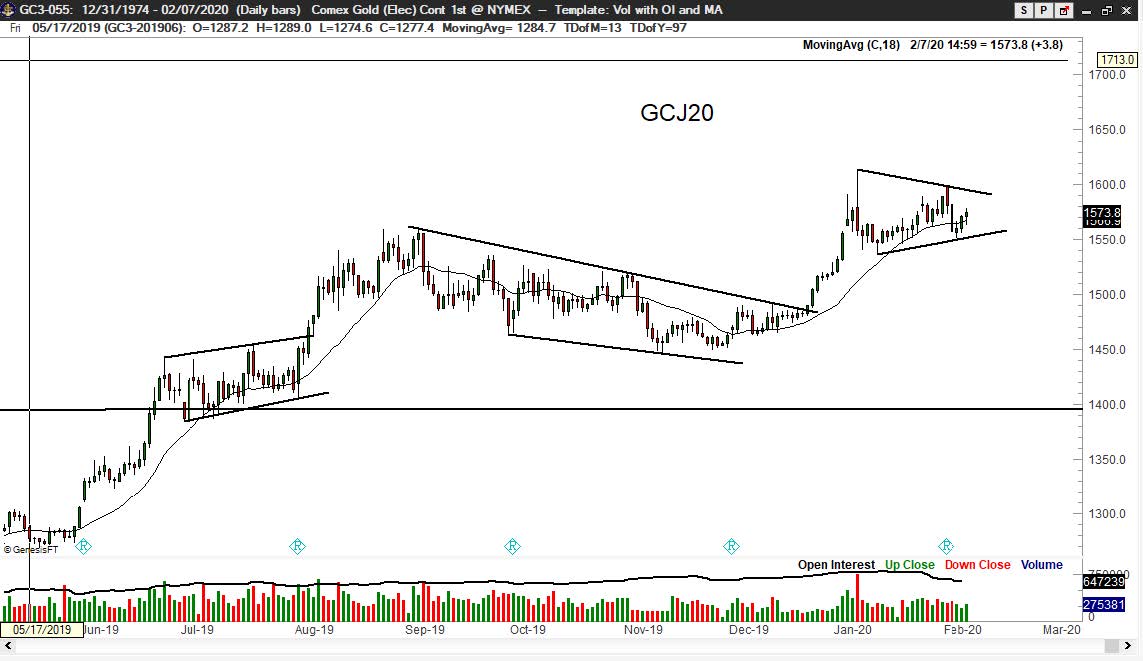
The daily chart could be forming a continuation symmetrical triangle.
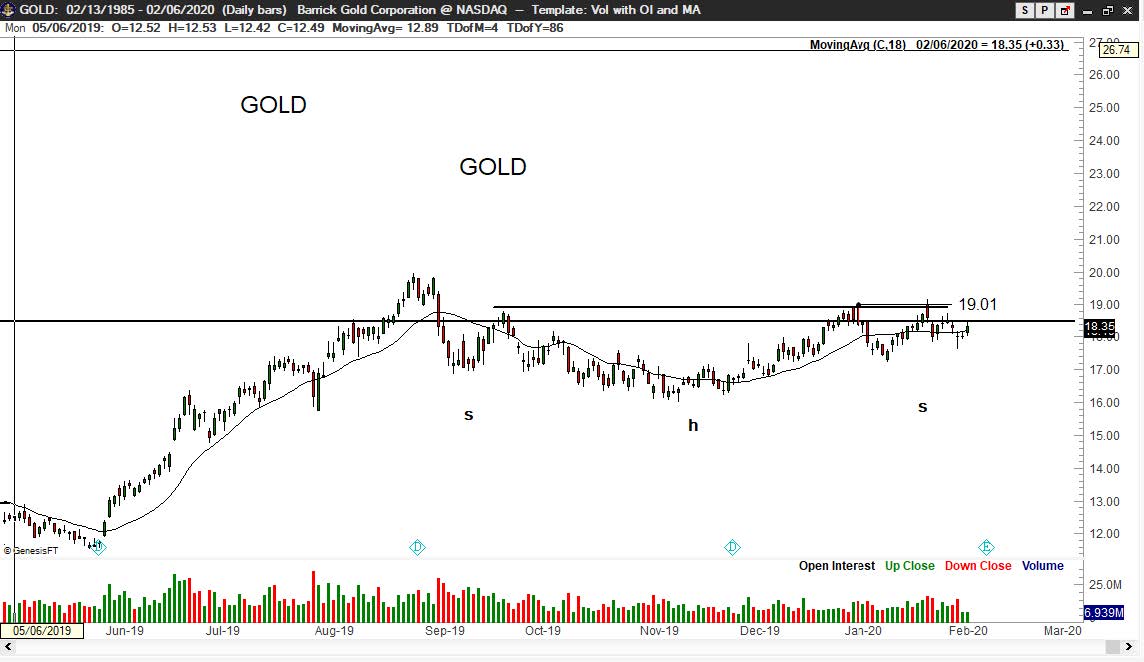
The daily chart of Barrick Gold Corp. could be forming a continuation H&S wherein the head is a rounding pattern.
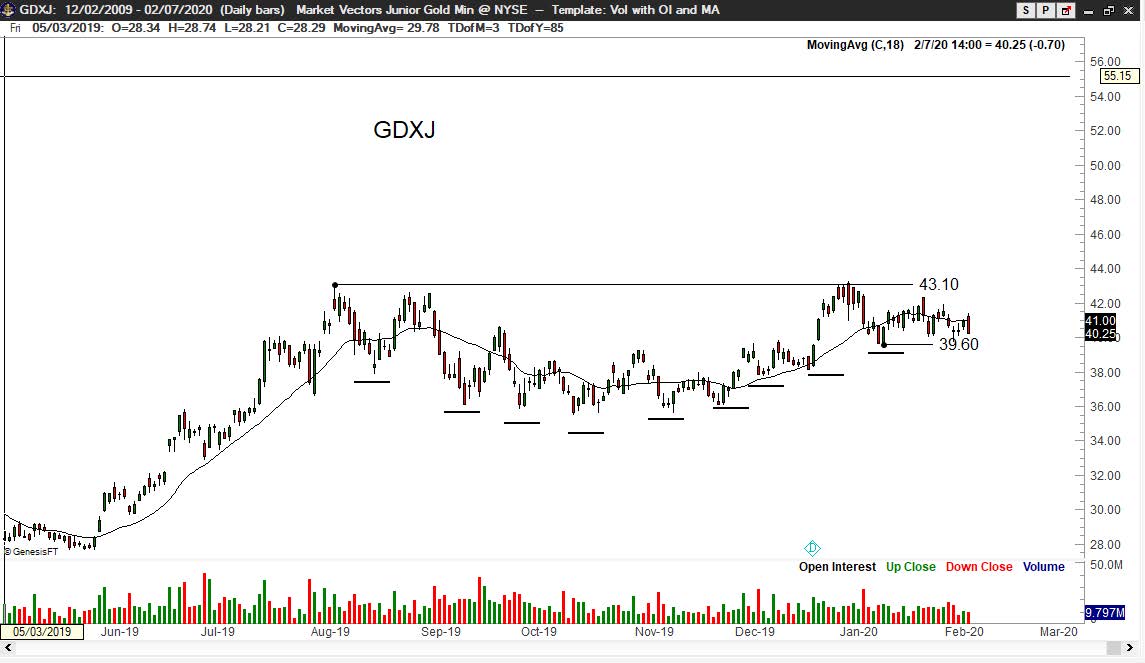
The daily graph is forming a saucer or scalping bottom pattern. Factor is flat –but interested. I will lose interest in this chart if the $39.60 level is penetrated on a closing basis.
.
Peter Brandt is a 40+ year veteran of trading. Through his Factor Service, members receive:
.
View your Factor Member options here. You could consider your membership in the Factor Service as just one more trade. If the Factor Service is not of value to you, well, it is just one more trade that did not work.
Through the Factor Service I endeavor to alert novice and aspiring traders to the many pitfalls you will face – and to offer advice on overcoming those pitfalls. My goal is to shoot straight on what trading is all about.
I hope you will consider joining the Factor community.


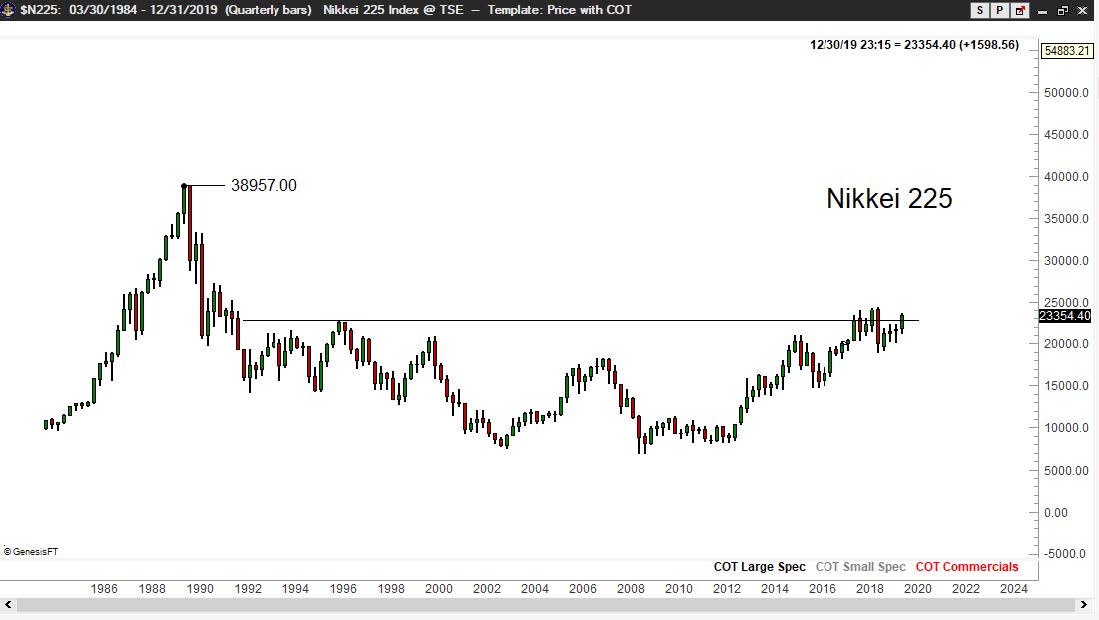
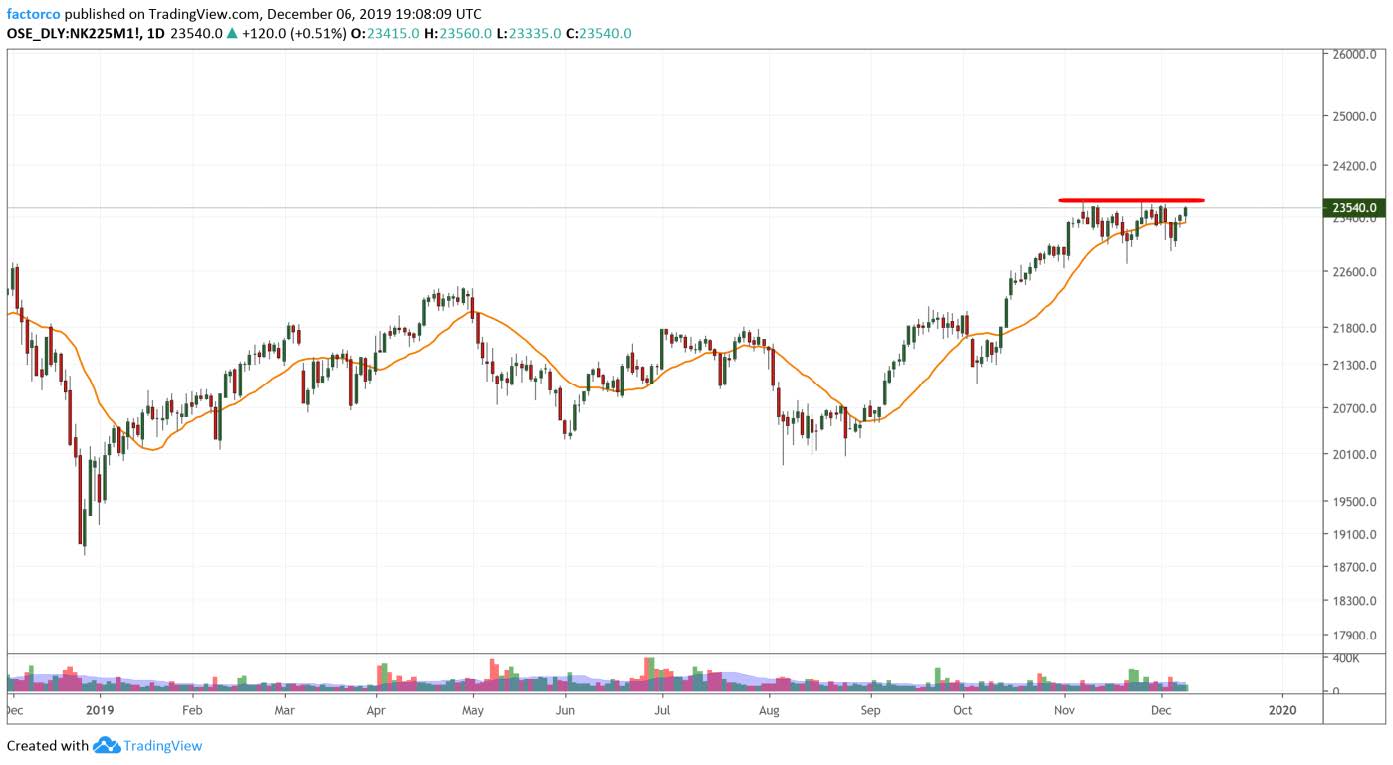
(This is a short excerpt from the past weekend premium member report published Friday morning the 6th)
The quarterly chart of the Nikkei Dow speaks for itself. Of course, there are some macro reasons why Japanese equities remain well under the late highs made in late 1980s. The daily chart is attempting to complete a small continuation pennant. Factor is long, having bought an anticipatory position on Thursday.
The daily chart is forming a possible ascending triangle. Factor is flat, but interested.
.
Peter Brandt is a 40+ year veteran of trading. Through his Factor Service, members receive:
.
View your Factor Member options here. You could consider your membership in the Factor Service as just one more trade. If the Factor Service is not of value to you, well, it is just one more trade that did not work.
Through the Factor Service I endeavor to alert novice and aspiring traders to the many pitfalls you will face – and to offer advice on overcoming those pitfalls. My goal is to shoot straight on what trading is all about. For more information watch my 30 minute webinar where we cover the Factor service in depth.
I hope you will consider joining the Factor community.

Note: Members of the Factor Service have already been made aware of the ideas presented herein — many Factor members have already taken action.
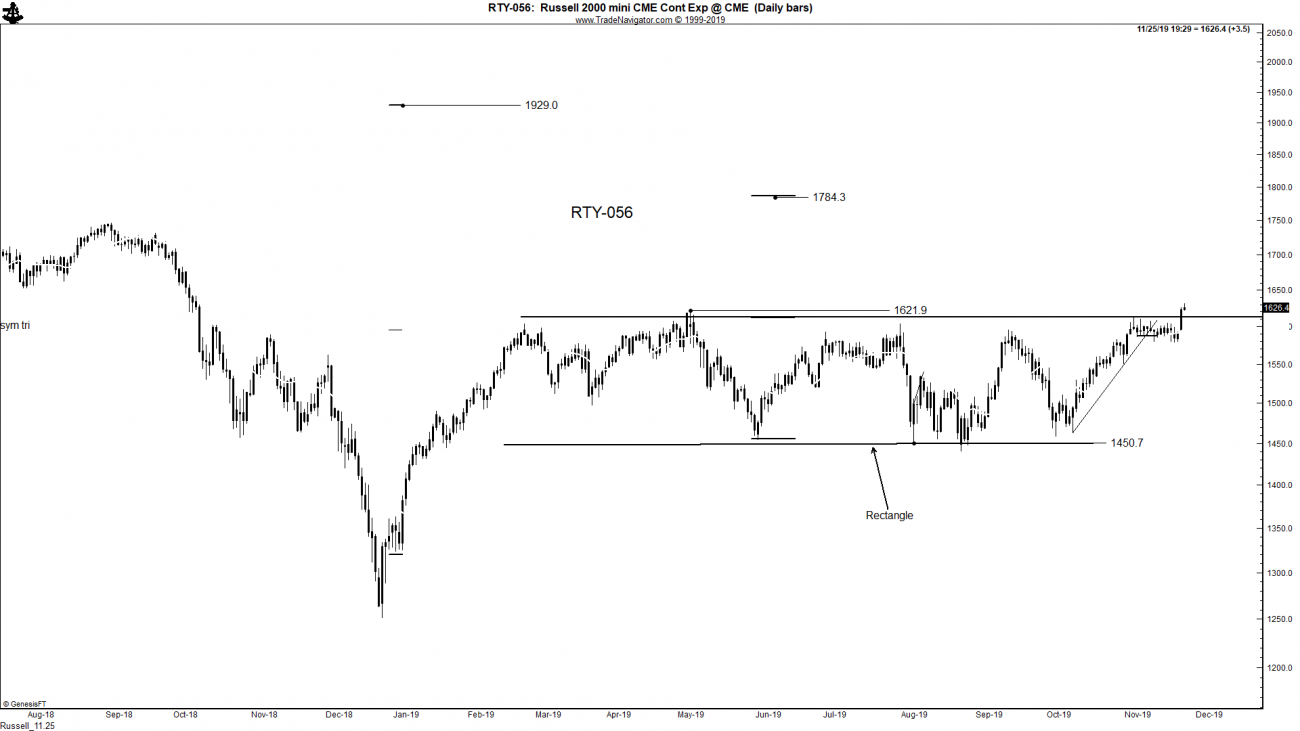
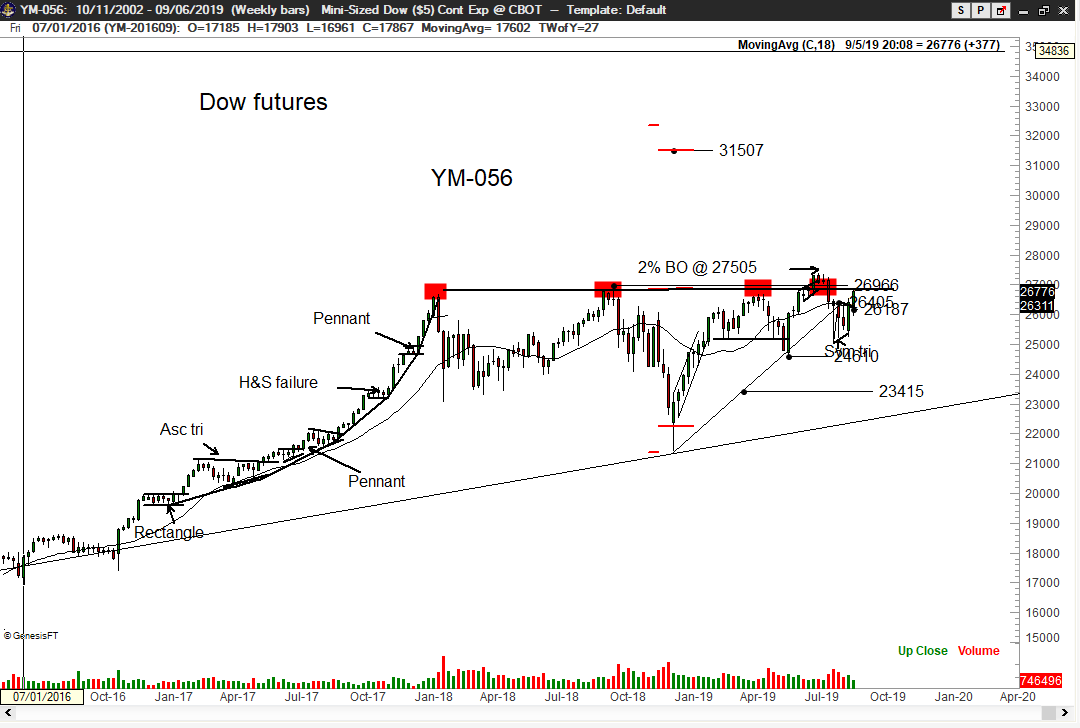
It appears that the bull trend in U.S. equities is now spilling over to mid caps and small caps. These stock indexes have substantial room to play catch-up and offer attractive profit potential for futures and ETF traders.
The Russell 2000 is attempting to breakout from a 9-month classical charting rectangle. This rectangle has targets of 1784 and 1929. Traders can choose from the mini Russell (CME) which carries a value of $50 for each point of price change or the micro Russell (CME) which carries a value of $5 for each point of price change. For example, an advance by the mini Russell from the present price of 1626 to the target of 1784 would represent a profit of $7,900 per futures contract. Each futures contract requires a margin deposit of $3,300. This interpretation of the chart will be null and void if the Russell declines below 1579. A decisive close above 1640 is required to confirm the upside breakout.
Futures contracts offer a much more efficient way to utilize trading capital and maximize profits — but also with commensurate risks. The Russelll ETF (IWM) is also attempting to breakout. I use a 2% breakout rule for ETFs. Thus, a close above 163.84 would constitute a price breakout. A close below 157.23 would negate a bullish breakout. With a profit target of 178.07, a purchase of 100 shares (cost of $16,384 at the breakout level) would offer a profit at the target of $1,423. The risk (using the 157.23 negation level) would be approximately $660 based on a 100-share purchase.
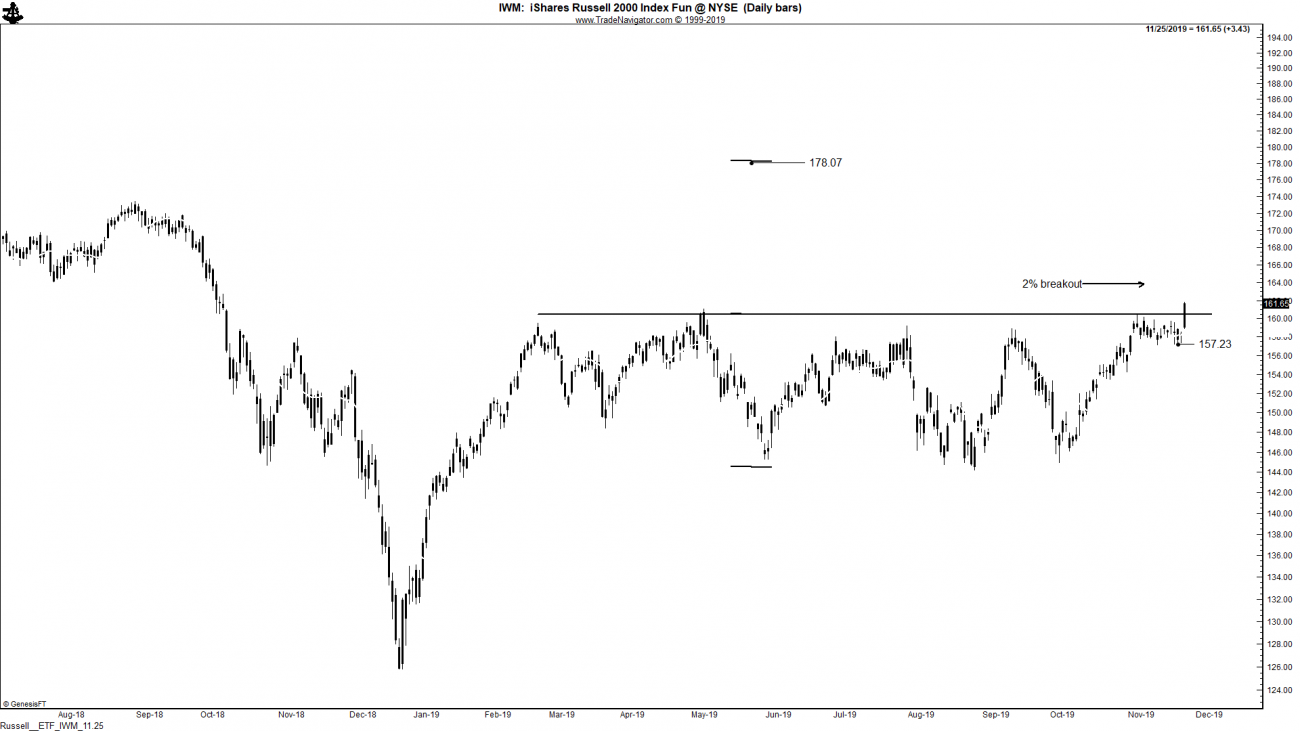
Obviously, futures trading is only for those traders with appropriate risk capital and temperaments. Yet, I hope the above example provides an excellent example of the benefits of trading futures vs. ETFs. While the ETF trade as laid out provides a 9% return of the capital used to buy the ETF, a futures contract offers a profit potential of more than 200% of the capital used to margin the trade.
While the profit potentials listed above are in relationship to the capital used to control the trades presented, the Factor Service believes that risk must always be measured against the total capital held in a trading account.
plb
###


 Read More
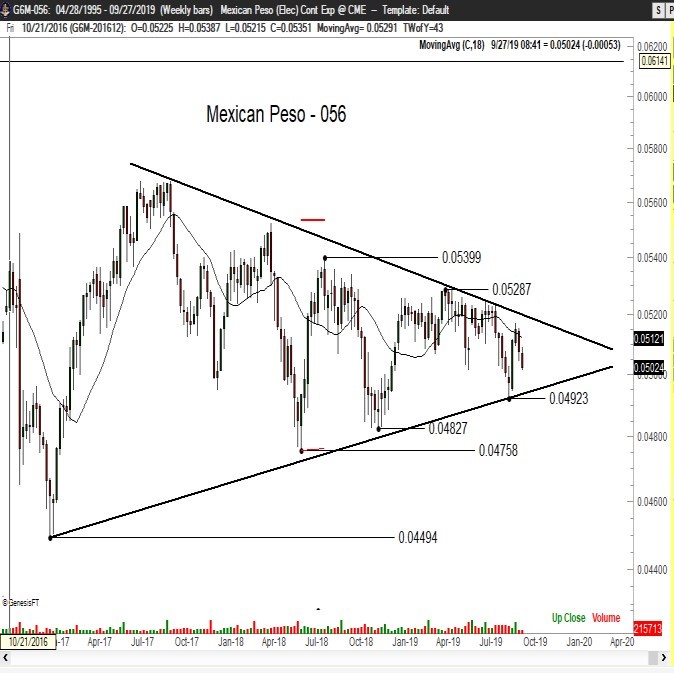
(This is an excerpt from the past weekend premium member report published last Friday morning the 27th)
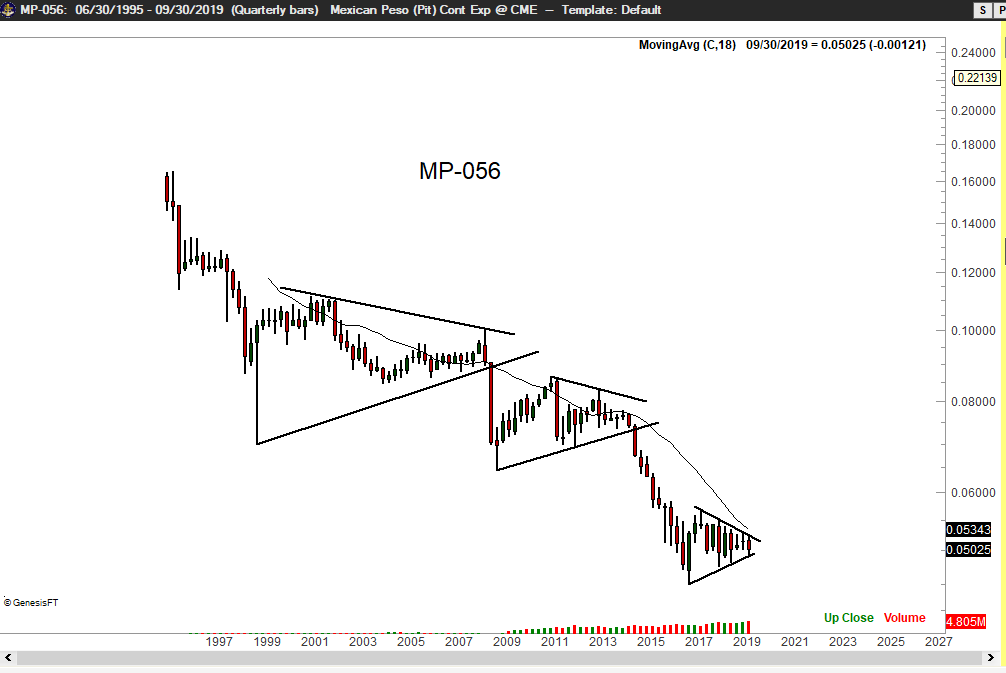
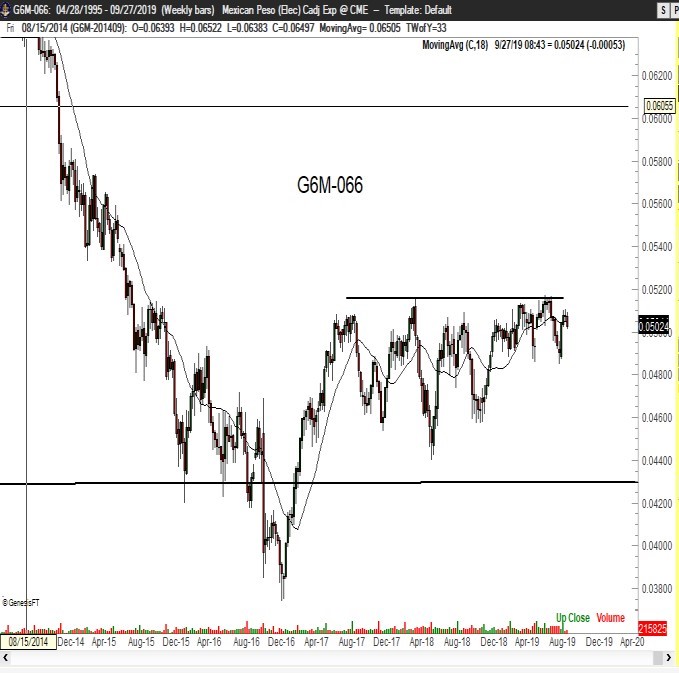
Peso futures have been in a bear trend during my entire trading career. The decline on the long-term charts has taken the form of repeated symmetrical triangles. The weekly futures chart is coiling. There are two caveats to a short side trade: Symmetrical triangles that continue past the 70% market toward the apex should not be trusted and this is an extremely negative carry trade with each successive futures contract priced at a lower price. The G6M-066 chart shows that traders constantly long the nearby Peso contracts and rolling at expiration have a positive return since early 2017. I will monitor this market but prefer the Brazilian Real.
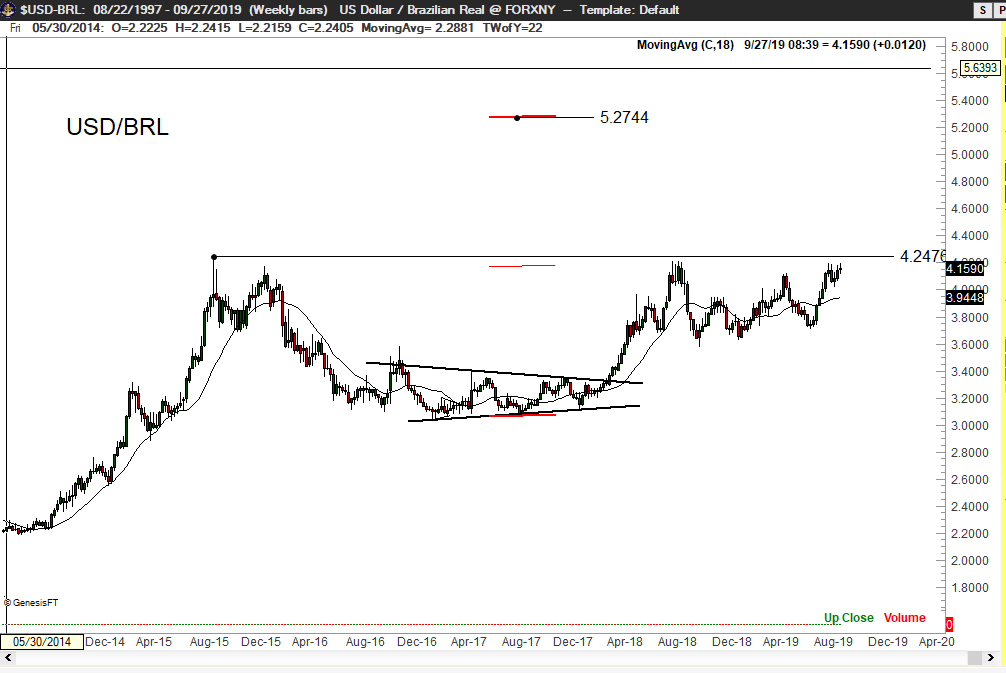
I have a greater interest in the Real than in the Peso. The weekly chart displays a massive descending triangle on the futures chart, traded in terms of the USD value of the Real (and a Cup and Handle on the spot graph, traded in terms of the number of Real per one USD). Based on CME settlement data as of Sep 26, the theoretical negative carry is approximately -300 BPs annualized.
.
Peter Brandt is a 40+ year veteran of trading. Through his Factor Service, members receive:
.
View your Factor Member options here. You could consider your membership in the Factor Service as just one more trade. If the Factor Service is not of value to you, well, it is just one more trade that did not work.
Through the Factor Service I endeavor to alert novice and aspiring traders to the many pitfalls you will face – and to offer advice on overcoming those pitfalls. My goal is to shoot straight on what trading is all about. For more information watch my 30 minute webinar where we cover the Factor service in depth.
I hope you will consider joining the Factor community.

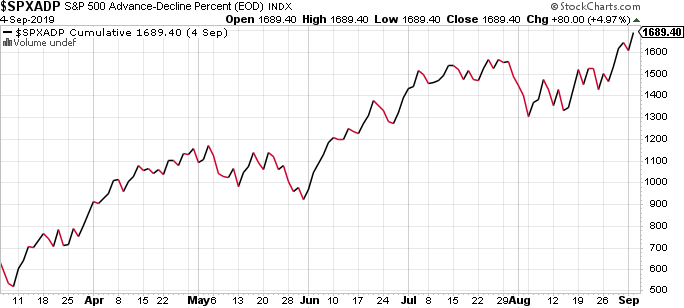
(This is an excerpt from the past weekend premium member report published last Friday morning the 6th)
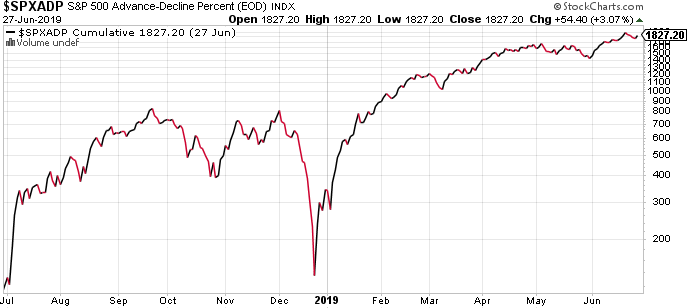
The S&P cumulative A/D line has posted a new high. The major indexes (DJIA, S&P 500 and NASDAQ) should be next to post ATHs.
I bought the completion of a rectangle on Thursday – and did so with hesitation knowing how frustrated I have been buying strength (over and over and over again) during 2019. The possible inverted H&S pattern has an up-slanted neckline.
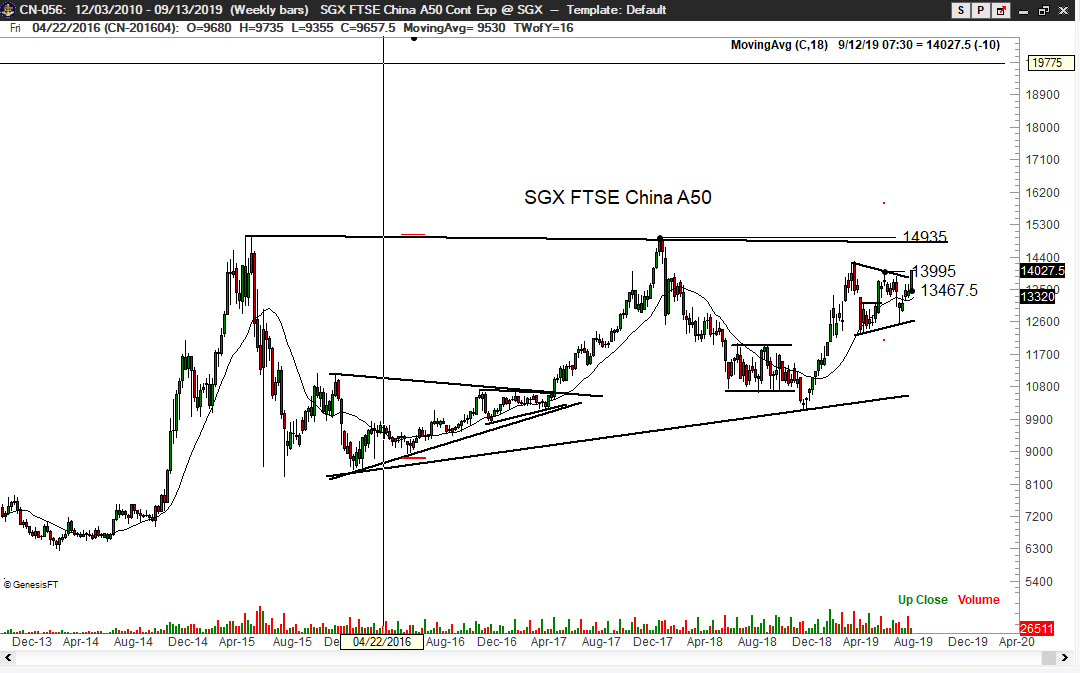
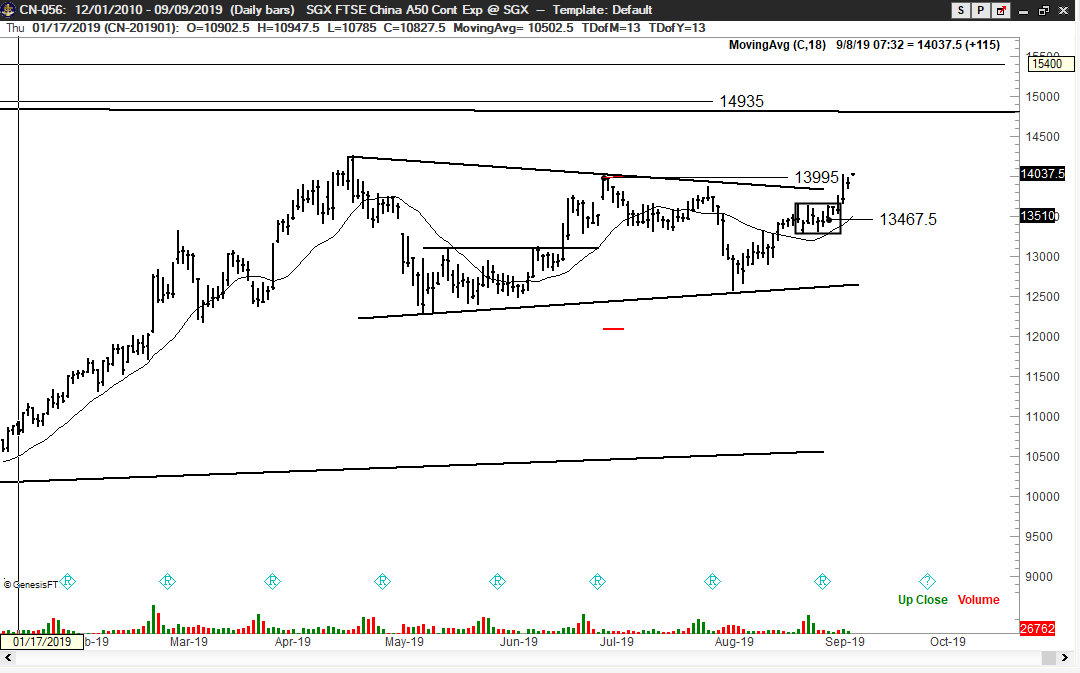
The monthly chart exhibits a possible 4-year ascending triangle. The daily chart is attempting to complete a continuation symmetrical triangle. Factor is long – note the small 2-week pennant on the daily graph (boxed). I have an interest in pyramiding this trade. A close above 13995 is needed to confirm the daily chart triangle.
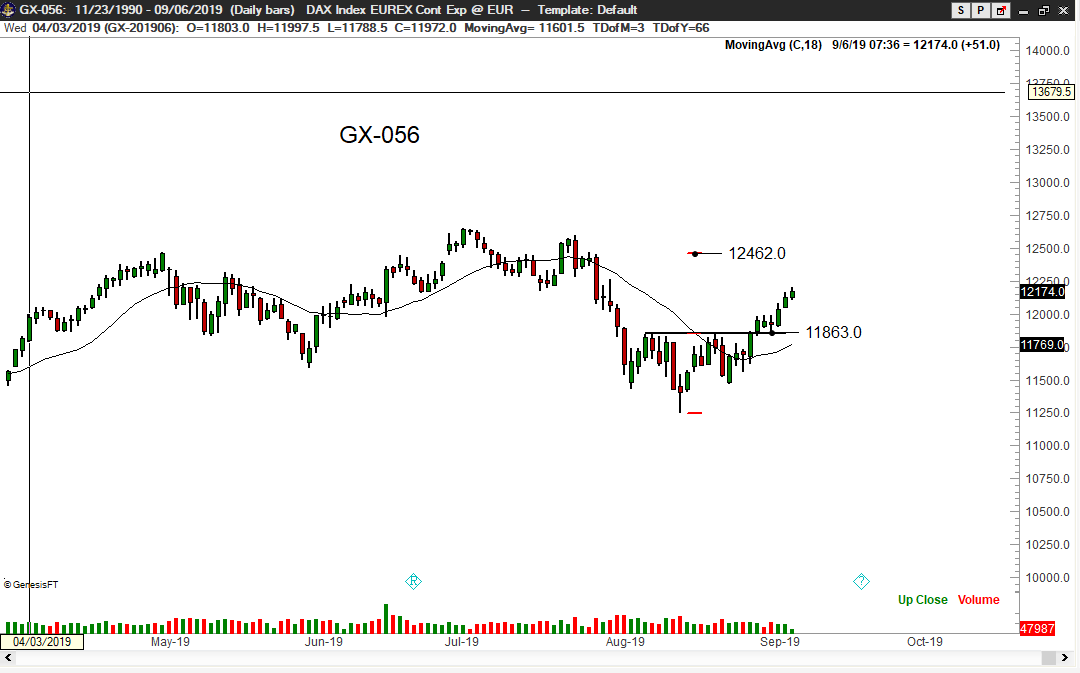
The advance on Aug 30 completed a small, but well-defined, inverted H&S bottom. Factor is long. The Sep 3 low is my pivot for protection. I will look to jam stops if the market approaches the 12462 target.
I view the weekly chart as a 17-month inverted H&S with a premature breakout in Jul.
Two weekly charts are shown to display the massive 17-month inverted continuation H&S pattern. The total- return chart is on the right. The prices on this chart include previous dividend payments. The chart on the left is ex-dividend (prices have been reduced by previous dividends). Factor is flat. I will buy a breakout.
.
Peter Brandt is a 40+ year veteran of trading. Through his Factor Service, members receive:
.
View your Factor Member options here. You could consider your membership in the Factor Service as just one more trade. If the Factor Service is not of value to you, well, it is just one more trade that did not work.
Through the Factor Service I endeavor to alert novice and aspiring traders to the many pitfalls you will face – and to offer advice on overcoming those pitfalls. My goal is to shoot straight on what trading is all about. For more information watch my 30 minute webinar where we cover the Factor service in depth.
I hope you will consider joining the Factor community.

(This is an excerpt from the past weekend premium member report published last Friday morning the 19th)
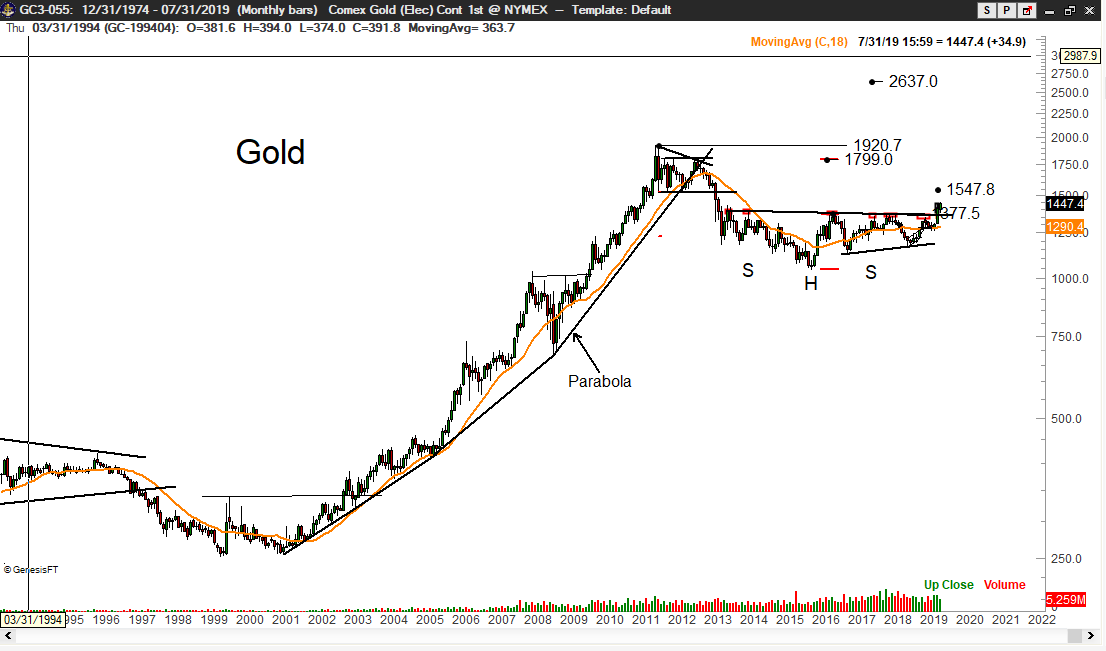
Perhaps we are finally involved in trade with a proper follow-through. Time will tell. The dominant chart construction in Gold is the completion of a 6-year inverted H&S bottom pattern wherein the right shoulder is a 3-year symmetrical triangle, as shown on the closing price chart.
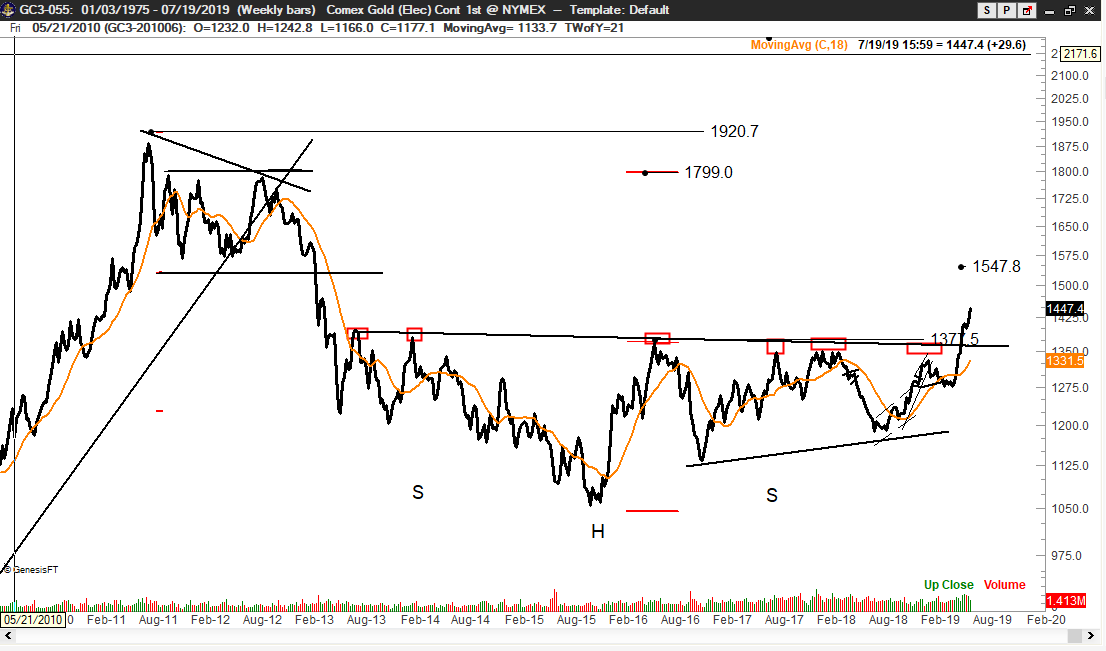
This continuation H&S pattern can be seen as part of a historic bull trend as seen on the yearly line and monthly candlestick charts. This pattern has a target of 1800, although a retest of the ATH at 1920 is logical. A further P&F target exists at 2637.
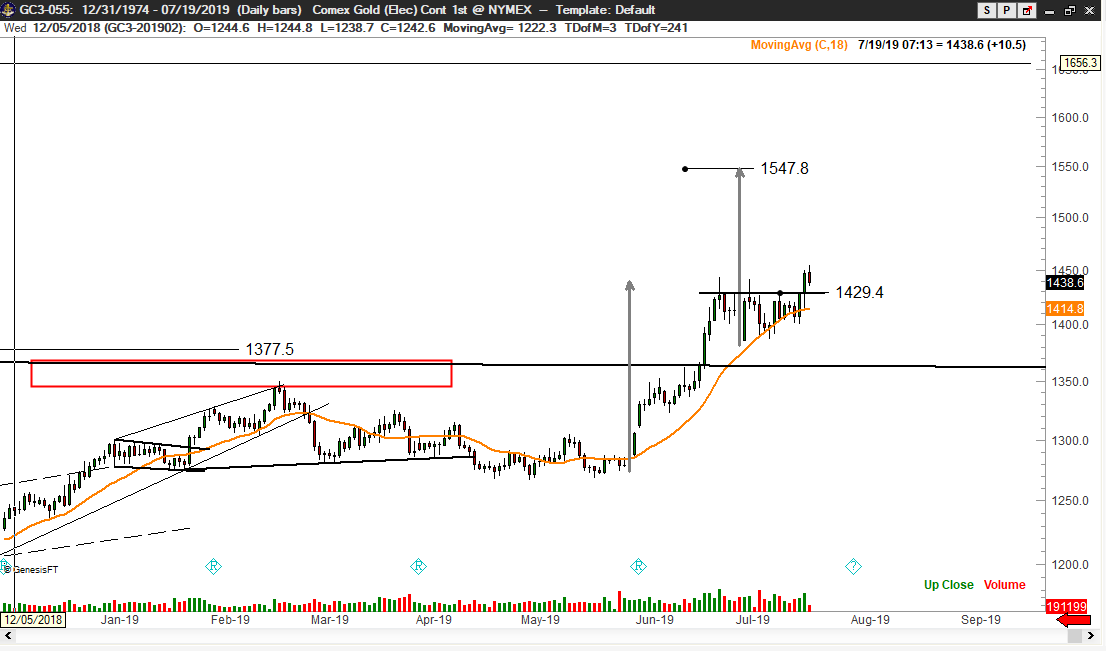
The advance on Thursday completed a possible 3-week continuation pennant. If this is a half-mast pattern, the target is 1547, as shown with the grey arrows. I am interested in buying a retest of the pennant if it occurs within the next couple of trading days.
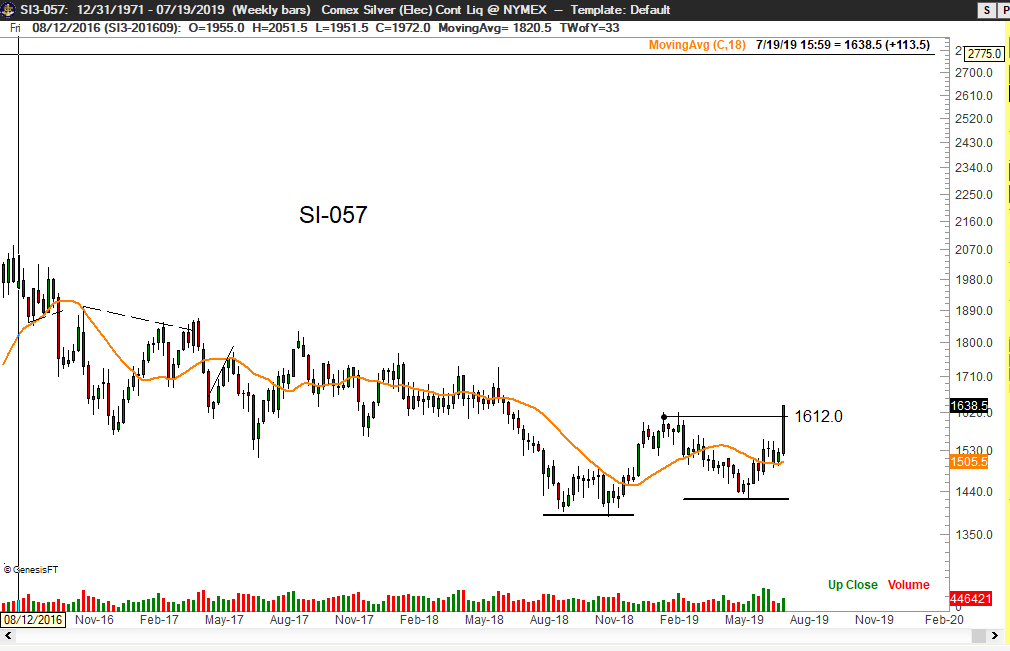
The advance this past week completed a possible 13- month “W” or double bottom on the weekly chart.
A 9-week horn bottom has been completed on the daily chart of the Oct futures contract.
.
Peter Brandt is a 40+ year veteran of trading. Through his Factor Service, members receive:
.
View your Factor Member options here. You could consider your membership in the Factor Service as just one more trade. If the Factor Service is not of value to you, well, it is just one more trade that did not work.
Through the Factor Service I endeavor to alert novice and aspiring traders to the many pitfalls you will face – and to offer advice on overcoming those pitfalls. My goal is to shoot straight on what trading is all about. For more information watch my 30 minute webinar where we cover the Factor service in depth.
I hope you will consider joining the Factor community.

(This is an excerpt from the past weekend premium member report)
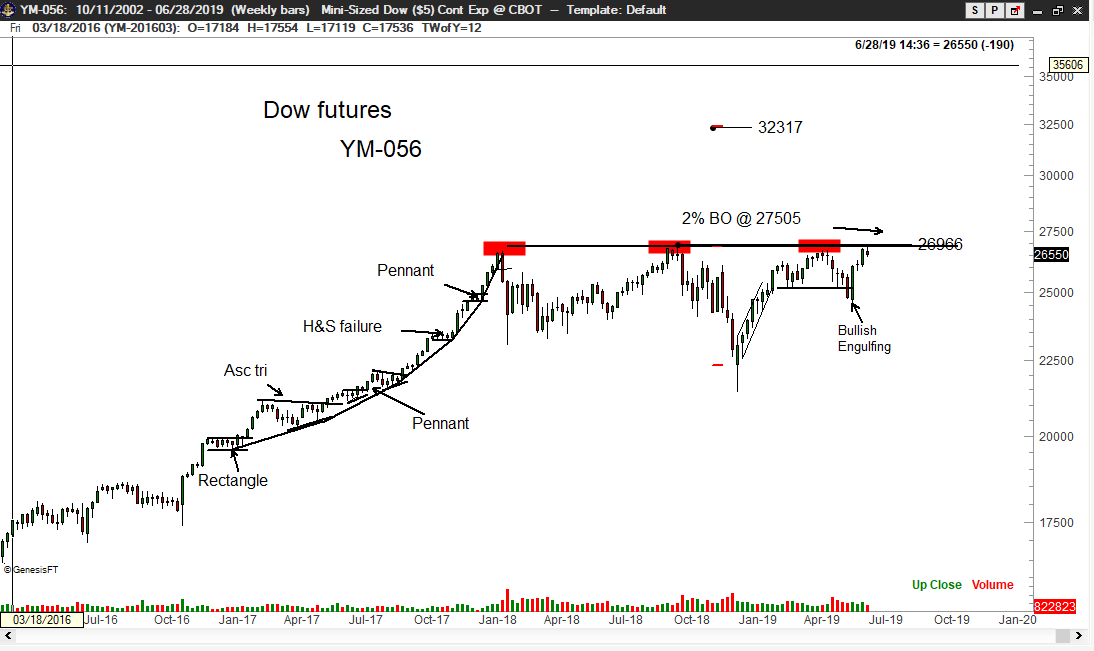
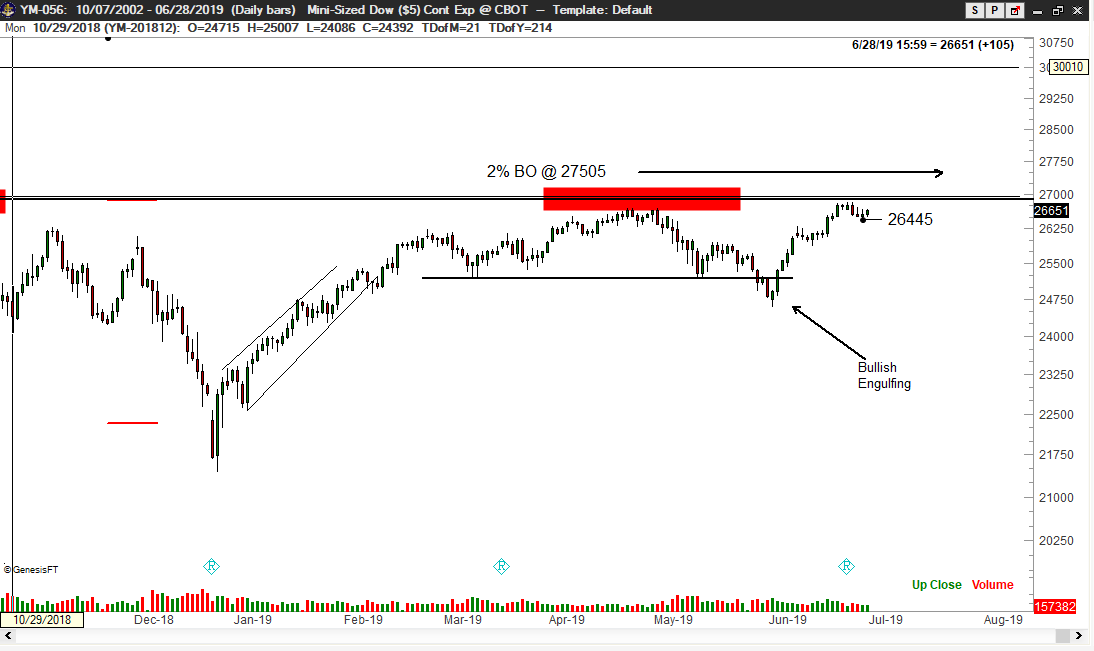
The cumulative A/D line for the S&P 500 remains close to a new high. I continue to view the S&P breadth to be positive for U.S. equities.
The DJIA has been unable to make a new high for the past 18 months. This is also true for the S&P 500. My thinking is that a decisive new high by these two indexes confirmed by a new high in the S&P A/D is required to put the cyclic bull trend back on track. The Factor Tracking Account is long the micro Dow Index.
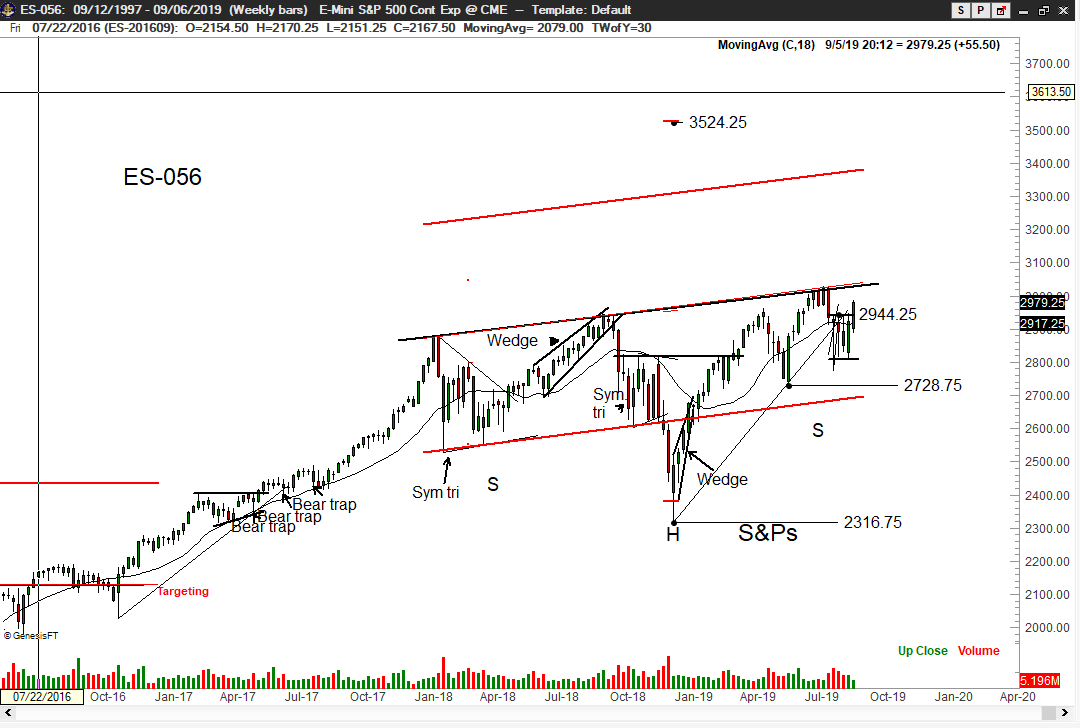
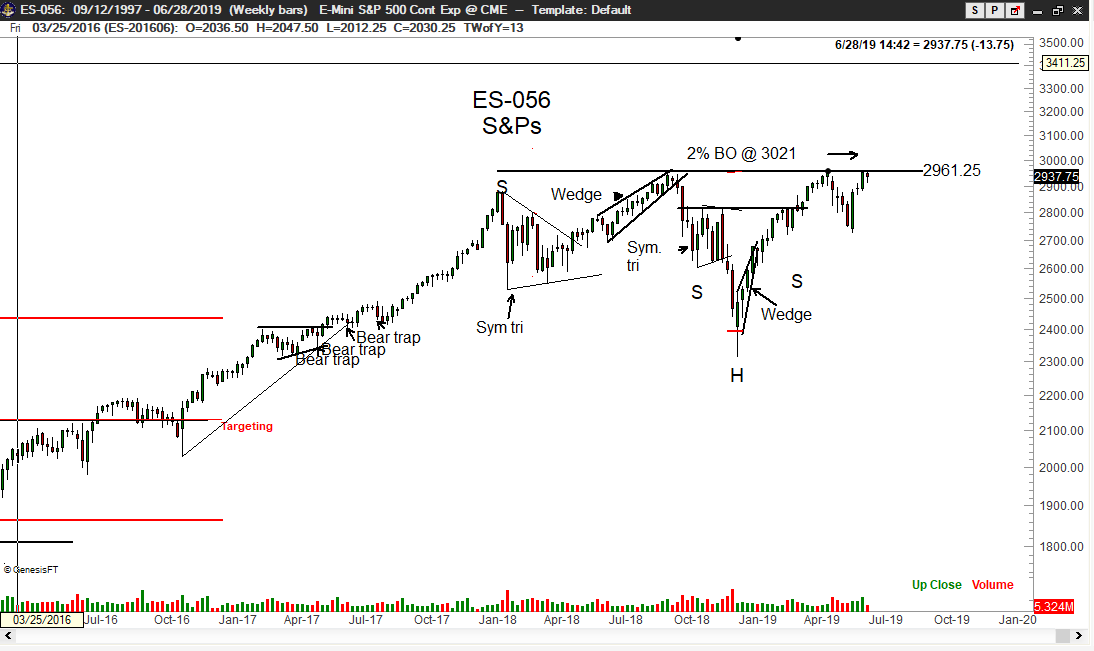
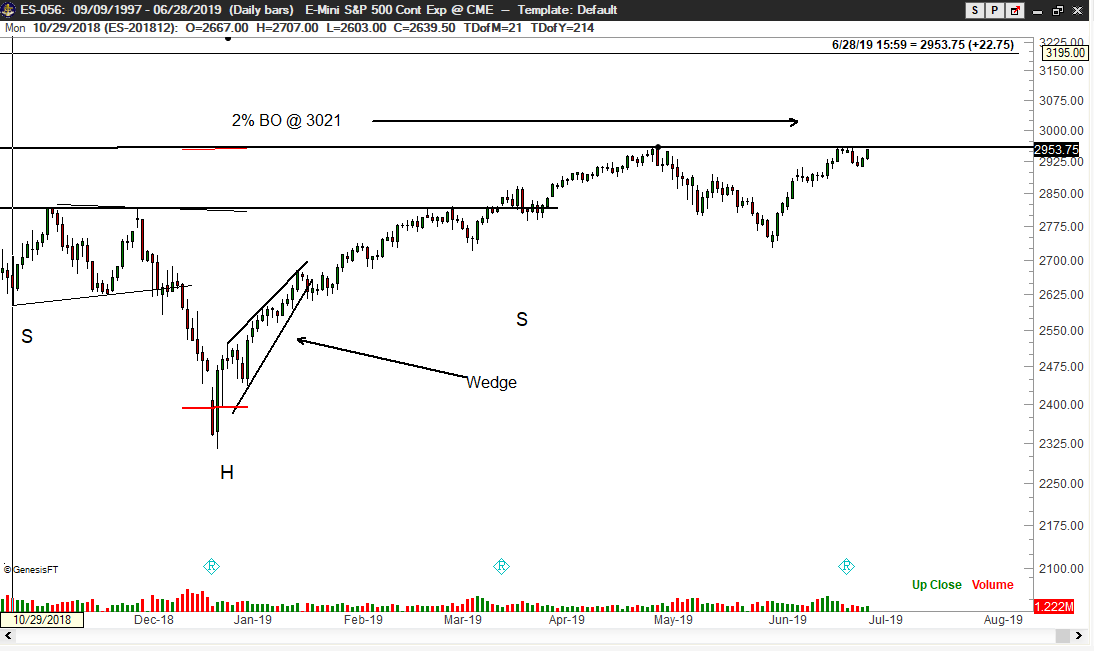
A decisive close above 3021 would be a breakout on the S&P chart. Such a close would establish a target of 3640. Factor is flat. I will buy S&Ps if it breaks out before Dow futures. I would not wait for 3021 before acting.
.
Peter Brandt is a 40+ year veteran of trading. Through his Factor Service, members receive:
.
View your Factor Member options here. You could consider your membership in the Factor Service as just one more trade. If the Factor Service is not of value to you, well, it is just one more trade that did not work.
Through the Factor Service I endeavor to alert novice and aspiring traders to the many pitfalls you will face – and to offer advice on overcoming those pitfalls. My goal is to shoot straight on what trading is all about. For more information watch my 30 minute webinar where we cover the Factor service in depth.
I hope you will consider joining the Factor community.
![]()
