Factor Update, March 27, 2016
Note: Due to our Easter Holiday schedule this is an abbreviated Factor Update with limited coverage of the markets under review by Factor LLC.
NOTE: This is a sample report that members of Peter Brandt’s Factor Service receive on a weekly basis. To consider membership, please visit this page for further details: Factor Membership Option
Market Review
Factor Moves are currently ongoing in: |
| · Japanese Yen |
· Crude Oil |
| A Factor Move was completed or terminated in Gold, Silver and USD/NOK. A Factor Move is developing in USD/SEK and AUD/NZD. This issue of the Factor also comments on the Soybean complex, Sugar, Gold, AVGO and global stock indexes. Also included in this Update is commentary on the process by which we throw in the towel on a trading position. |
General trading commentary
Novice traders often begin their speculative endeavors with many false assumptions. Of course, the marketplace charges a heavy tuition fee (in the way of trading losses) to correct false assumptions. Once such false assumption is that profits can be made in any and all market environments – a trader just needs to constantly adapt to changing trading environments to figure out how to cash in on the price moves. As an example, a novice day trader or scalp trader may believe that each new day in the S&Ps is a blank slate – he or she just needs to find the formula that will work for that day. Such thinking is faulty and will result in long-term trading frustrations and capital losses.
A trader cannot be successful over an extended period of time without having an organized and systematic process of trade identification, overall risk management, trade sizing, trade management and emotional/psychological stability. The reality is that any given approach to trading will have good times and bad times, good weeks and bad weeks, good months and bad months, good years and, yes, even bad years. Certain trading environments are very favorable to my approach to market speculation – an approach based on identifying certain types of chart configurations. Other trading environments are hostile to my approach, but may be very constructive for other approaches to market speculation such as option spreads or mean-reversion strategies.
As I appraise the current trading environment, I perceive three conditions:
1. A lack of development of the type of patterns that have historically produced my bottom line
2. False breakouts galore
3. Increased volatility that defies understanding from a classical charting perspective

I have faced markets such as this in the past, and will face them again and again. Based on my trading history, such market conditions do NOT correlate with profitability during the subsequent 3-months. Some traders attempt to more actively trade themselves out of hostile trading conditions. This is not my philosophy. While I will continue to take good signals as they occur, I have sized down my trading leverage and increased my scrutiny on candidate trades. There is a time to be active and aggressive in trading … and a time to be timid. Most of the current daily charts do not make sense to me, so why should I be trading. The thin ice sign is posted at Factor LLC. If you are interested in constantly pursuing trading activities, then the Factor is not for you. There are certain set ups that are in my sweet spot and others that are not. I am willing to wait for certain pitches before swinging. |
Factor Moves in Progress
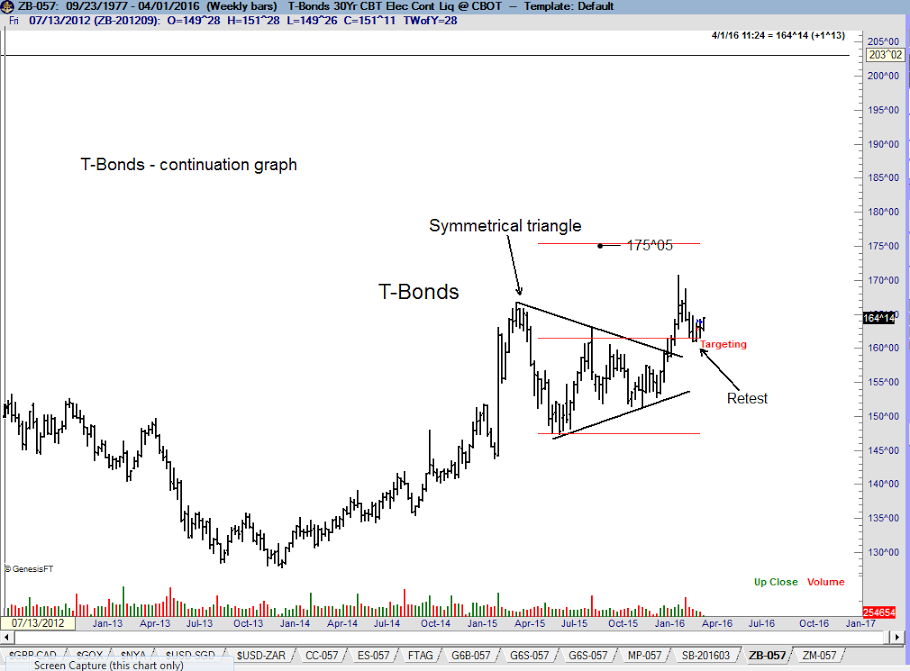
Crude Oil (weekly and daily charts)
The dominant chart construction in Crude Oil appears to be a completed 14-month falling wedge. In his seminal 1932 book, “Technical Analysis and Stock Market Profits,” Richard W. Schabacker identified five patterns that are capable of reversing a dominant trend.
- Head and Shoulders
- Broadening top
- Double top/bottom
- Rounding variations
- Rounding top/bottom
- Common turn
- Triangle variations
- Symmetrical triangle
- Right-angle triangle
- Wedge
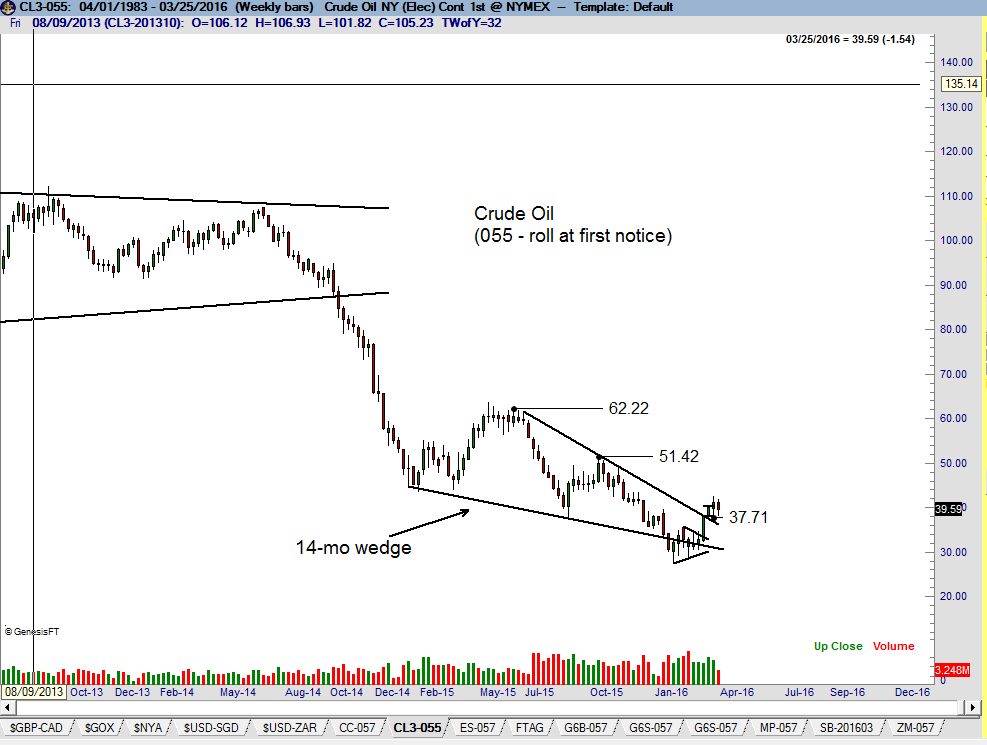
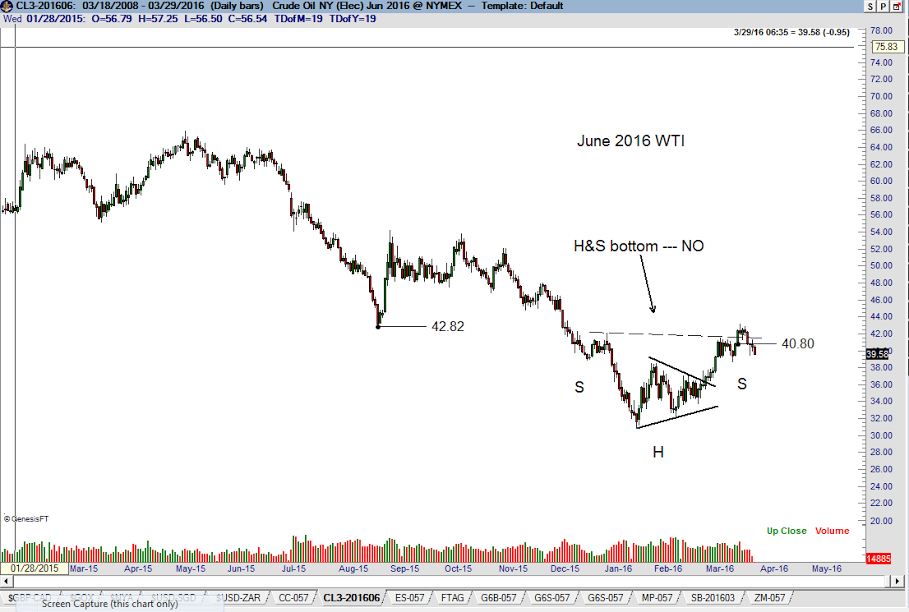
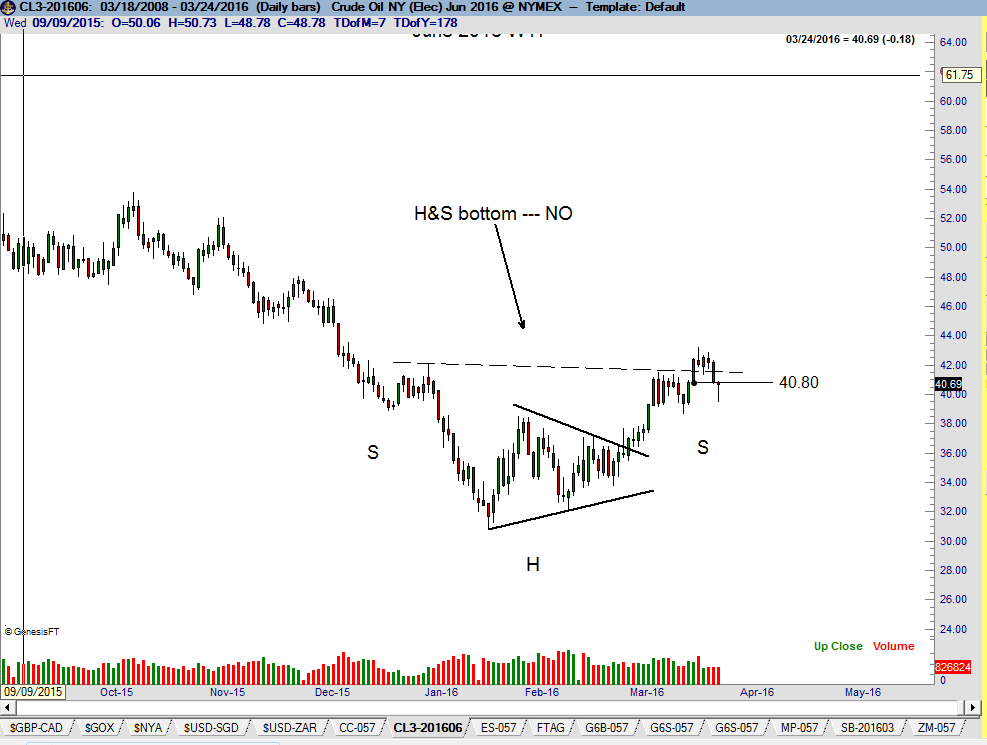
Of these five, the triangle is the least reliable. Triangles, especially wedges, have the tendency to morph into more complex and lengthy area patterns. Even if properly diagnosed, the falling wedge can be a very difficult pattern to trade because of its tendency to produce erratic trends. For now, the falling wedge labeling appears to be the best guess. The daily chart of the June futures contract displays what many chartists declared last week to be a H&S bottom. I did not accept this labeling because valid H&S bottoms must have overlap between the shoulders and the head. Such does not define the June Crude Oil chart. Factor is flat Crude Oil.
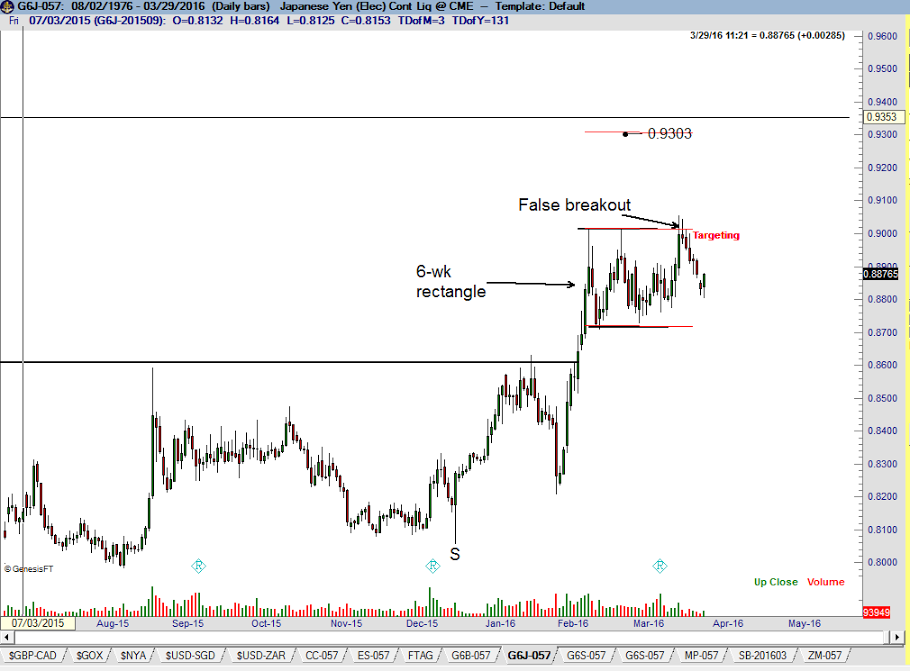
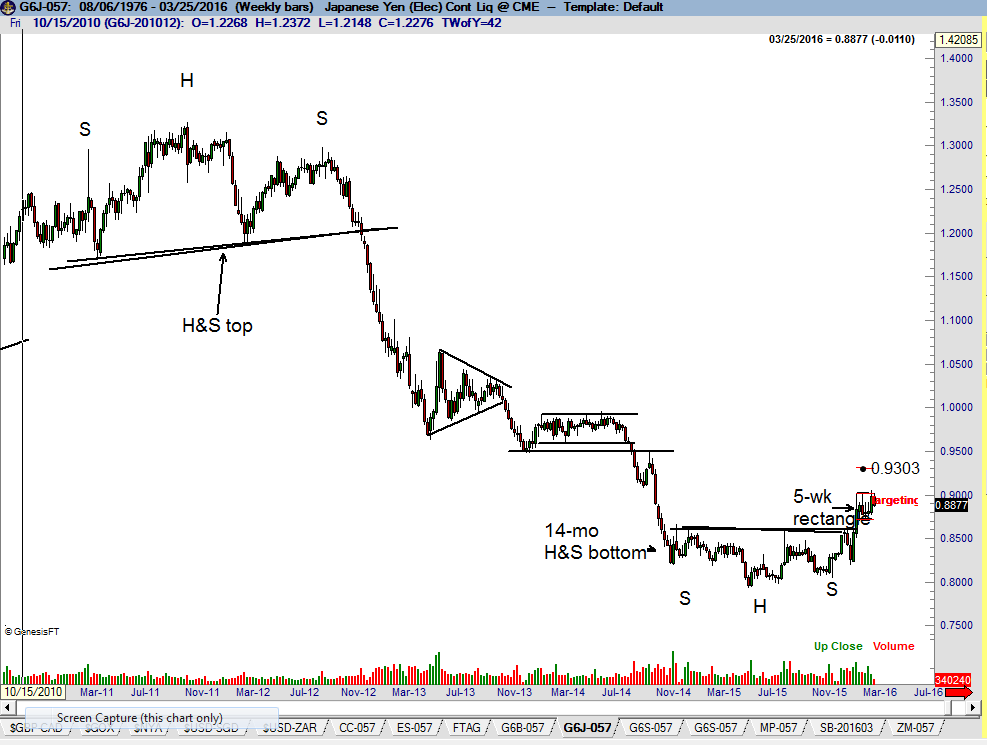
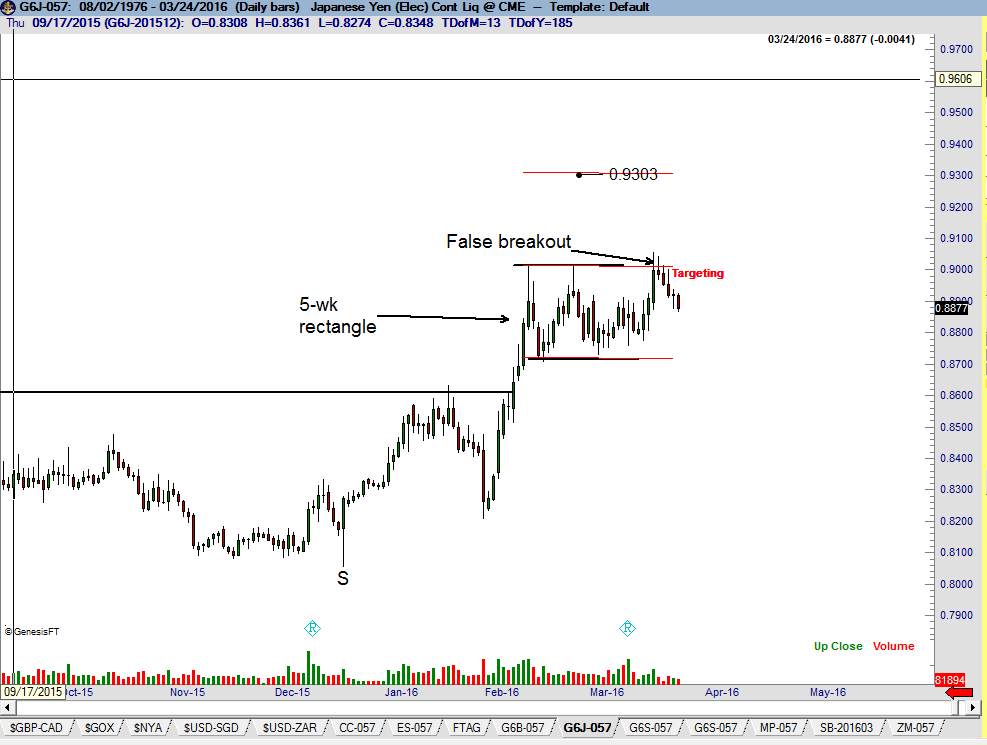
Japanese Yen futures (weekly and daily charts)
The dominant chart construction continues to be the underlying completed 14-month H&S bottom on the weekly graph. The rally on Mar 7 appeared to have completed a 5-week continuation rectangle. But it now appears that the Mar 7 thrust was a bull trap – and traders who bought this false breakout will need to be washed out before the market can regain its bullish footing. I remain constructive on the weekly chart, but the daily chart is now uncertain.
Other Markets
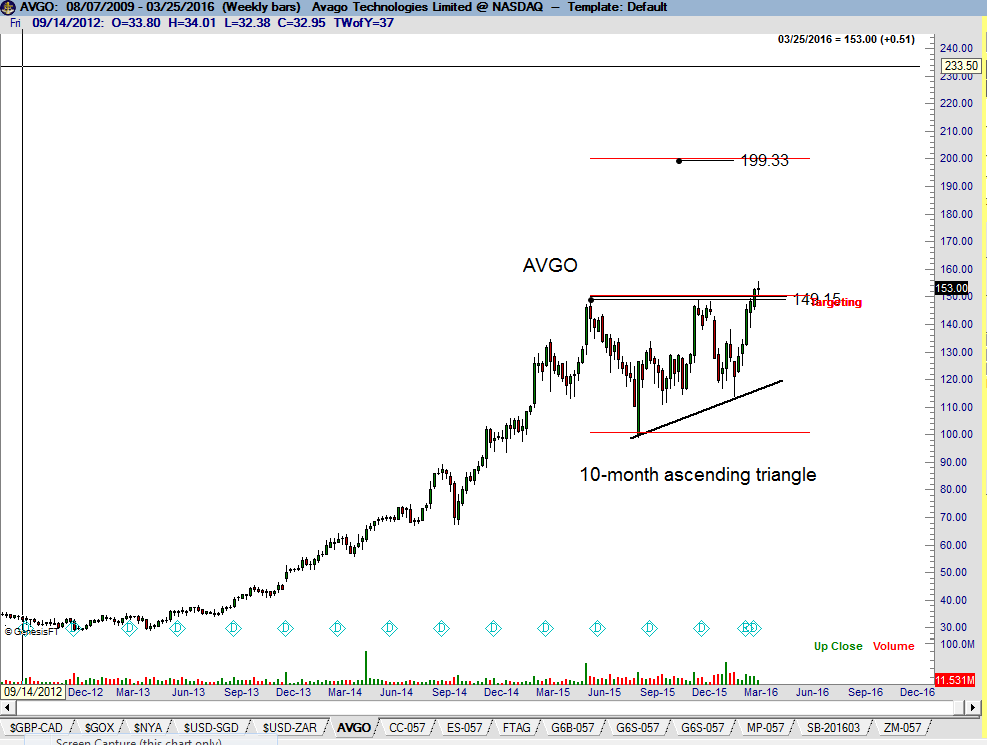
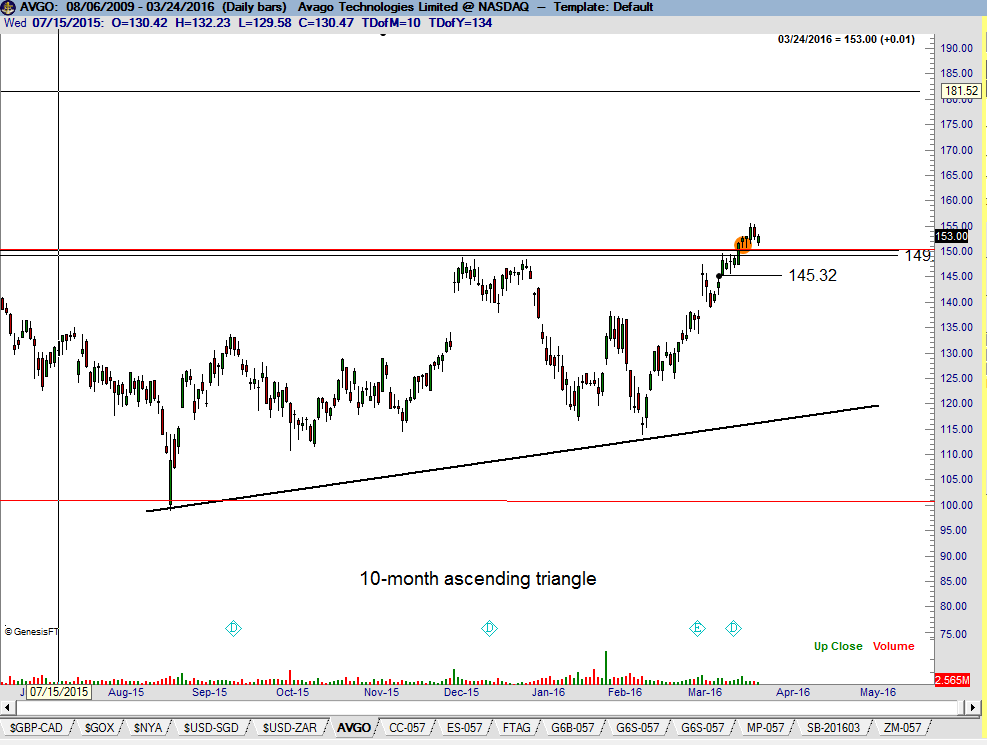
AVGO
Most of my stock trading is done in my IRA account and not discussed in Factor updates. I do occasionally purchase individual stock names in my futures/forex trading account. AVGO is an example. The dominant chart construction is the completed 10-month ascending triangle on the weekly graph. My point of defense is now the 145.32 level. I am risking 65 basis points on the trade.
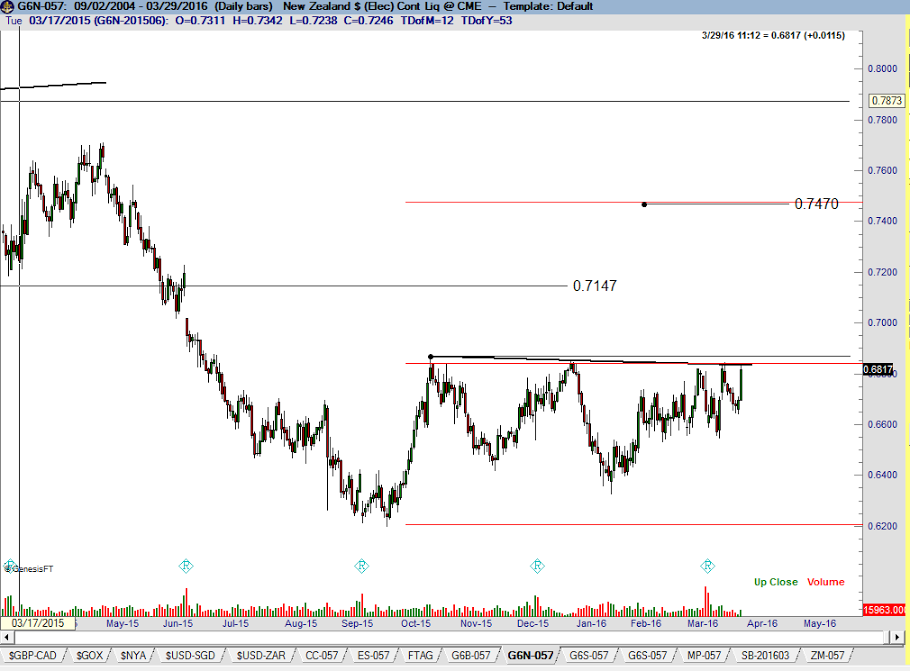
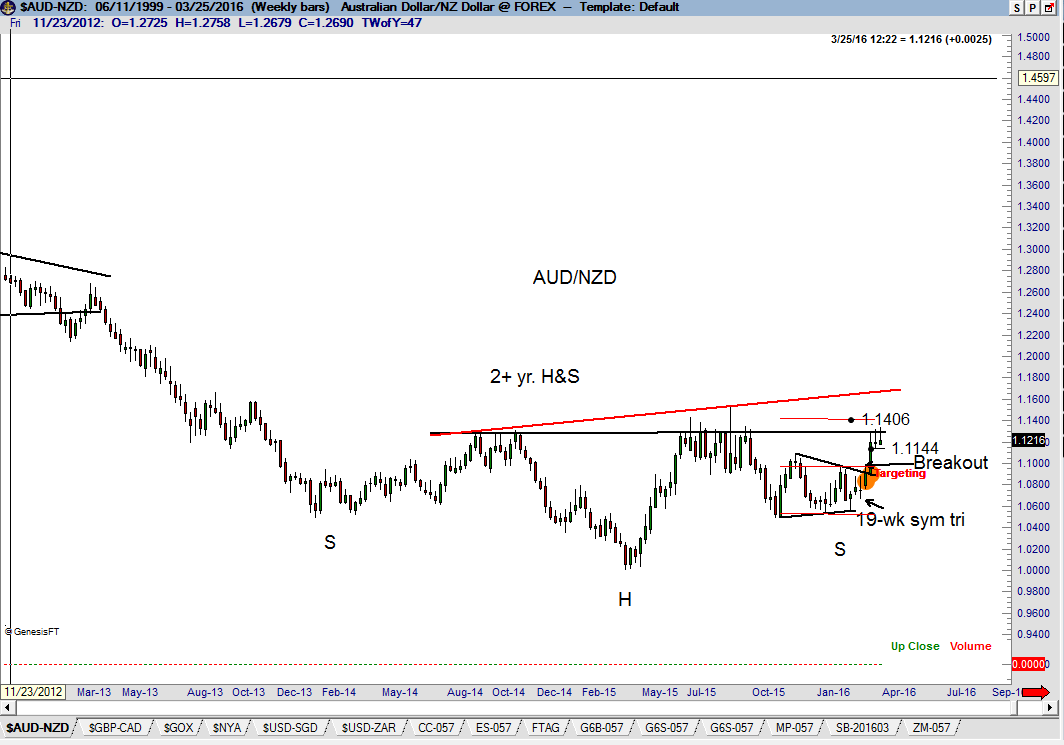
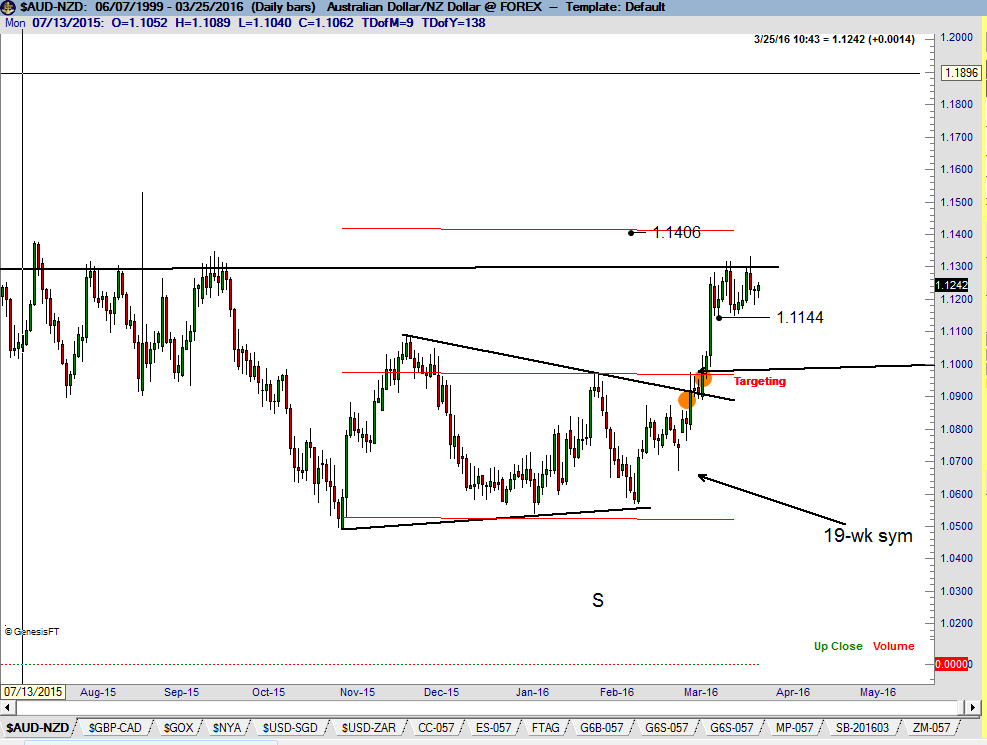
AUD/NZD (weekly and daily charts)
I have re-categorized AUD/NZD from an ongoing Factor Move to a developing Factor Move. The dominant chart construction is the ongoing development of a 2+ year H&S bottom on the weekly graph, with the right shoulder taking the form of a completed 19-week symmetrical triangle. The chart displays the difficulties to identify the exact drawing of a neckline. Using the orthodox highs from Jul/Aug 2015 would produce an up-slanted neckline (red line). I always prefer a horizontal neckline even if it means slicing through some “out-of-line” bars. The symmetrical triangle on the daily graph has a target of 1.1406. If reached, the H&S bottom will arguably be completed. I took profits on 2/3rds of the position near the 1.1300 level. This exited trade was based on the daily chart triangle. I existed because I believe the neckline is a strong resistance area. I will monitor the H&S for a breakout to move back to a full long position. The 1.1144 level will be my point of defense on my current long exposure.
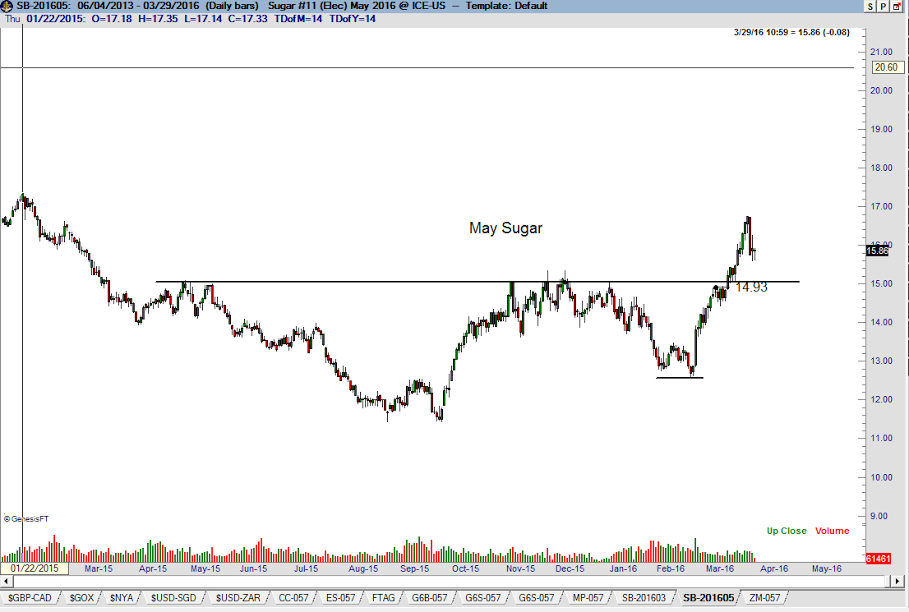
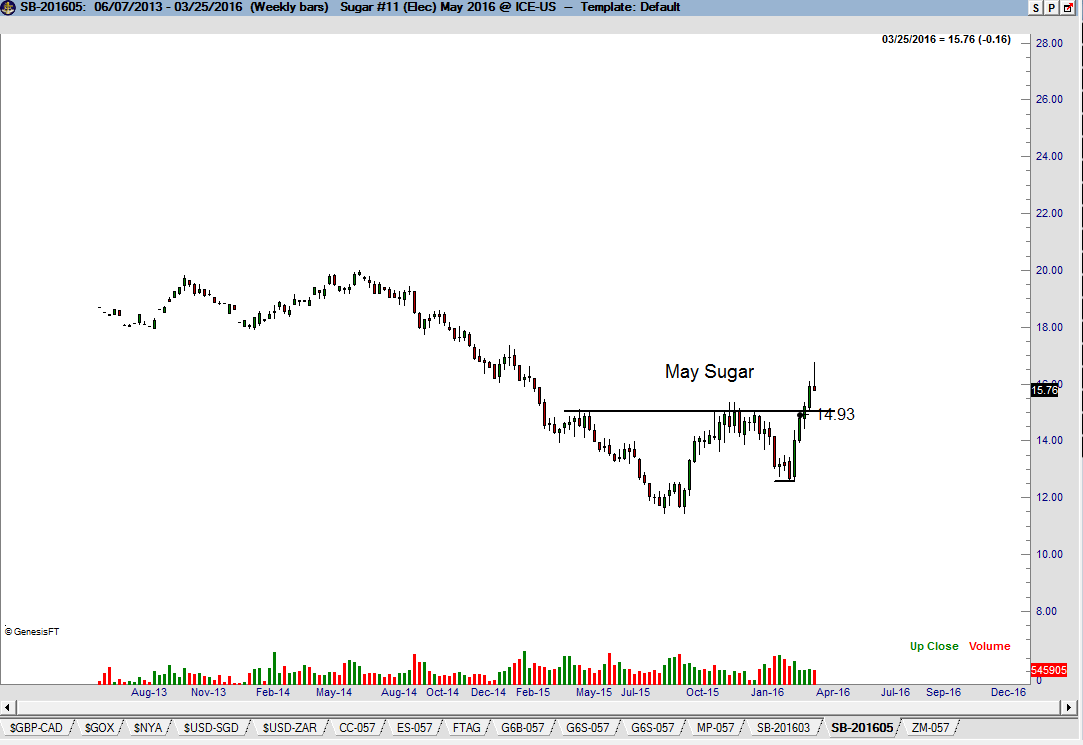
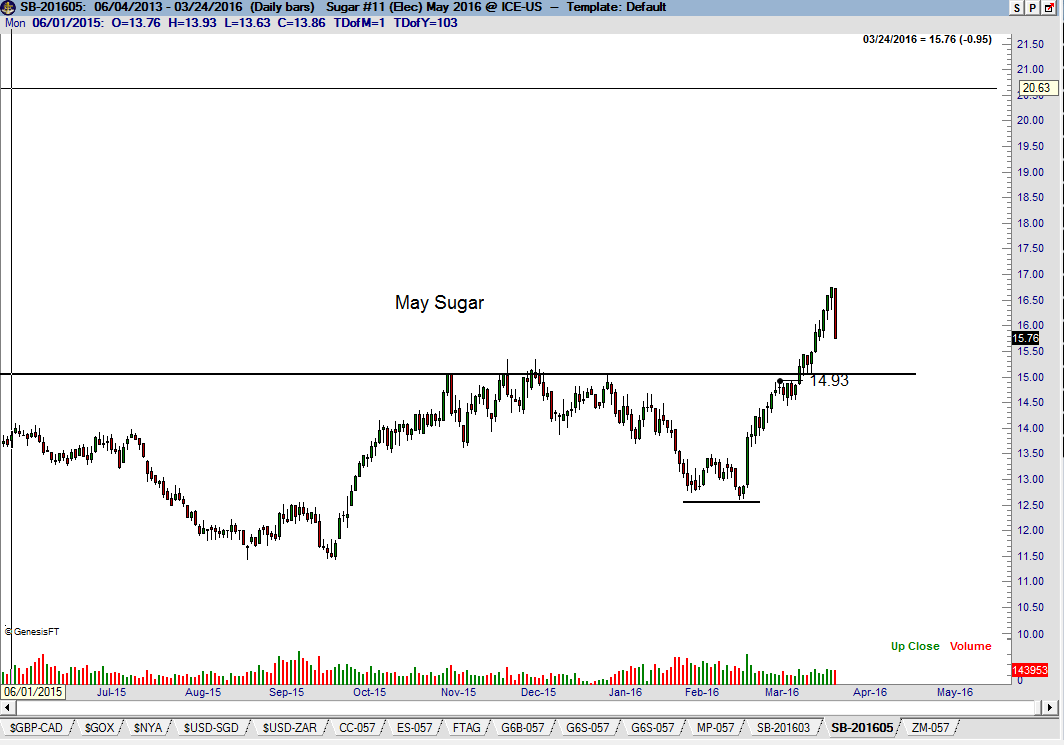
Sugar (weekly and daily charts)
The weekly chart of May Sugar appears to have completed a common-turn bottom. The sharp run up of recent weeks produced a sharp profit-taking shake-out on Thursday. The 15-cent level should provide support and a possible buying opportunity. I am willing to take a shot at the long side if the 15-cent level is successfully tested.
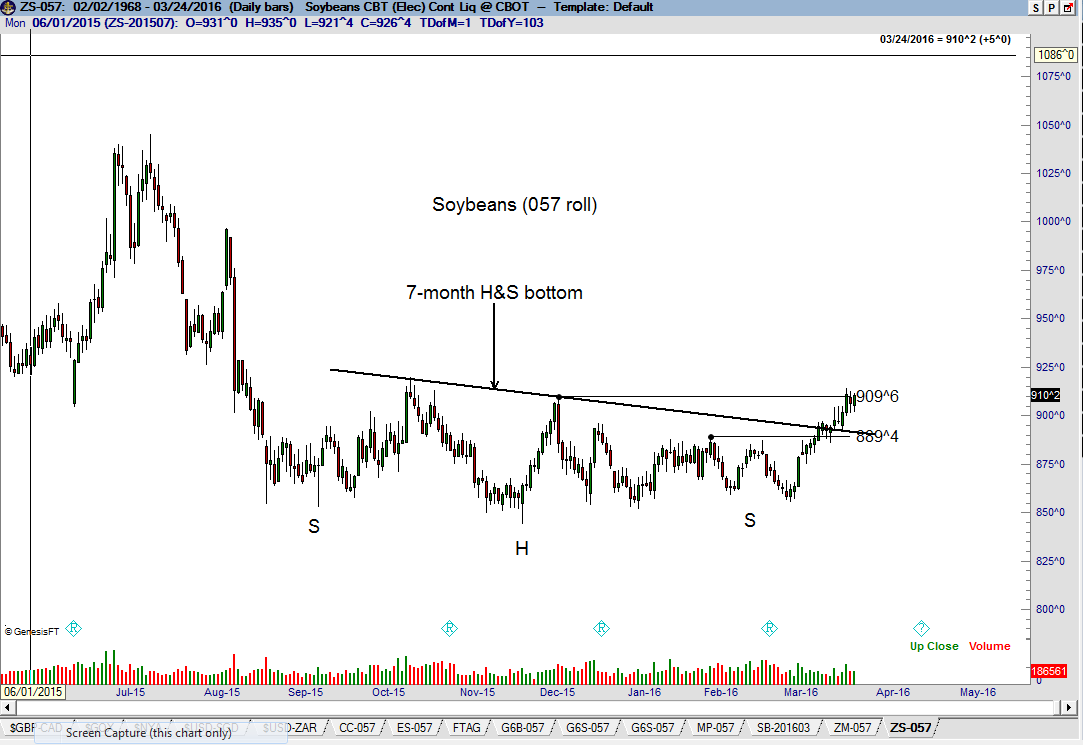
Soybean complex
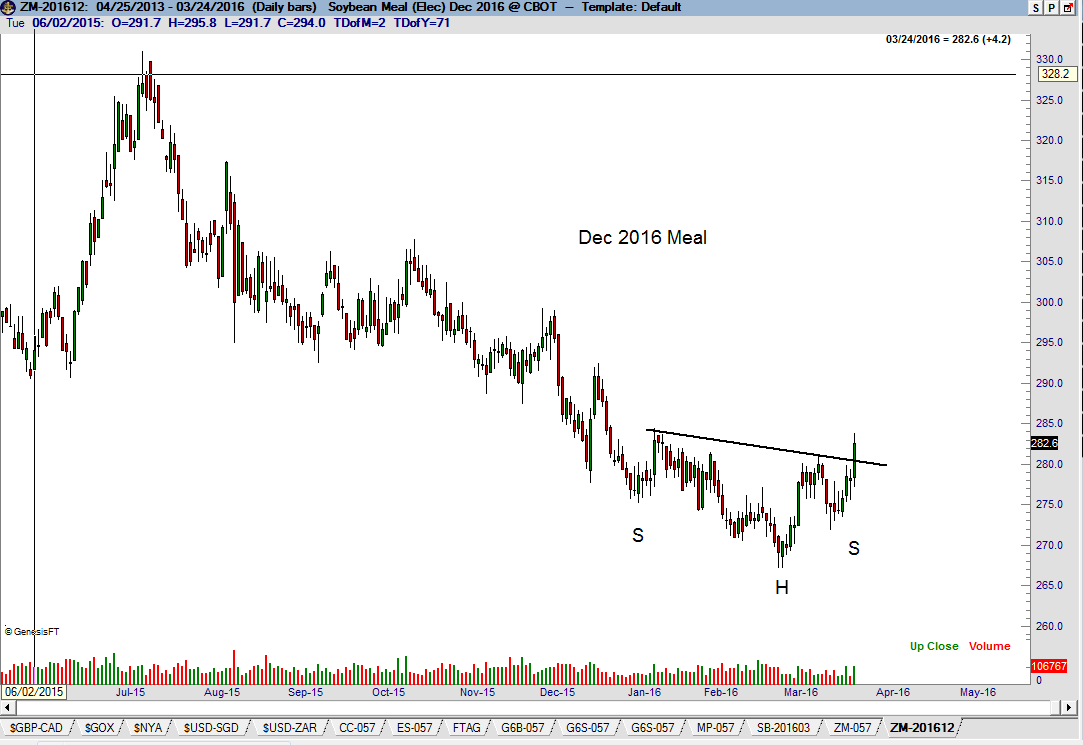
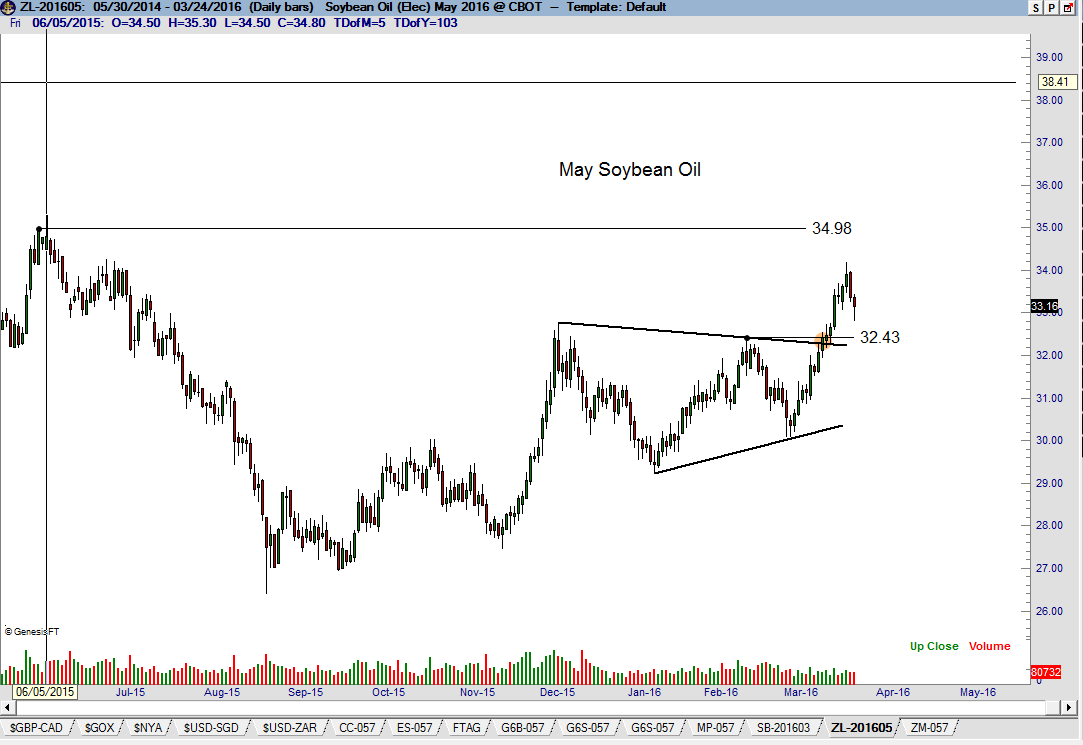
The daily continuation chart in Soybeans displays an arguably completed 7-month H&S bottom. The advance on Mar 21 convincingly cleared the neckline, although a decisive close above the right shoulder high at 910 is required to confirm this pattern. The problem with Soybeans is that individual contract months do not display counterpart patterns. Using continuation charts for generating trading themes is very useful, but individual contract months must provide timely signals. This is not the case in Soybeans. Nevertheless, I will buy Soybeans with a risk point in the May contract of 889. It is possible to label the Dec Soybean Meal daily chart as a completed H&S bottom. I am not a big fan of H&S bottoms with down-slanted necklines (or H&S tops with up-slanting necklines). The May Soybean Oil daily graph shows a completed continuation symmetrical triangle pattern. My philosophy is to always be long the strongest related market when long and short the weakest related market when short. Accordingly, Soybean Oil is the leader at the present time. Factor is flat, having taken a profitable swing trade in Oil. I missed buying the dip below 33 cents on Thursday – “my bad.” I have an interest in having long-side exposure in the Soybean complex. There is a possibility that Beans are completing a sizable bottom.
Charts of Soybean Meal and Soybean Oil.
U.S. stock market (misc. charts)
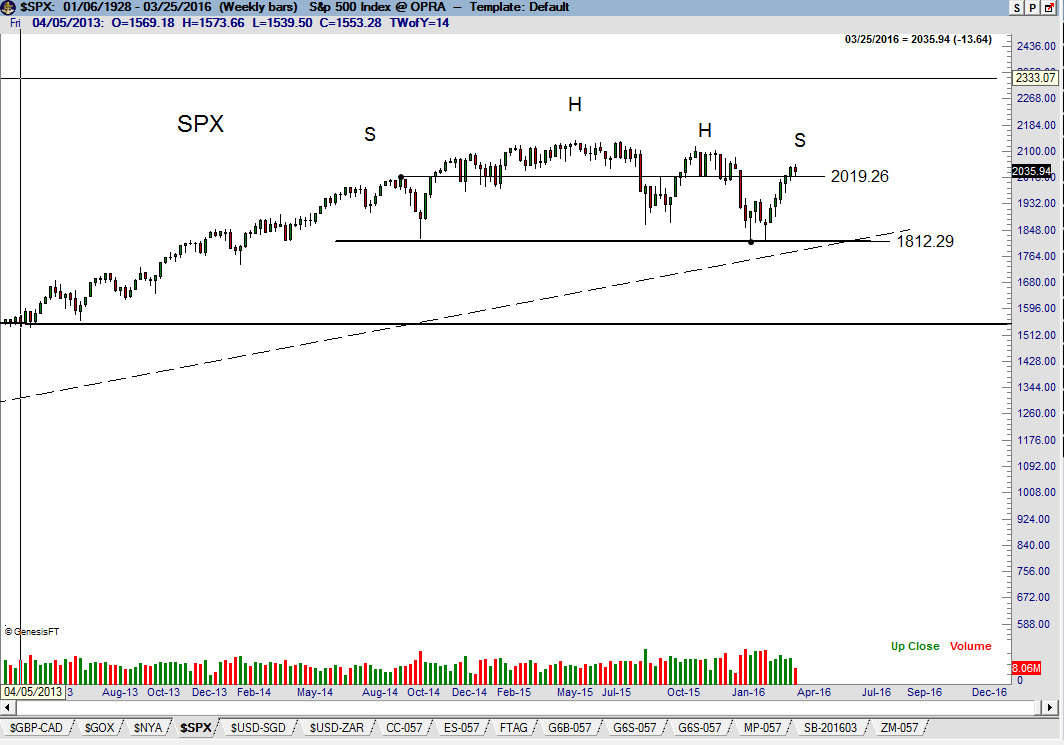
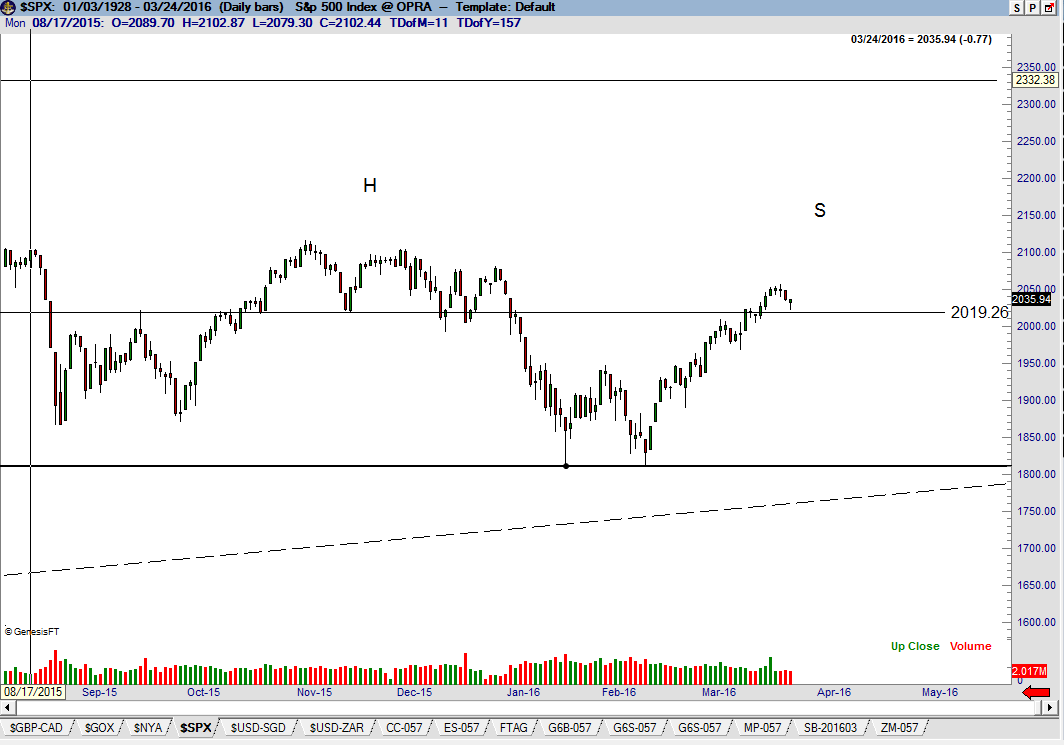
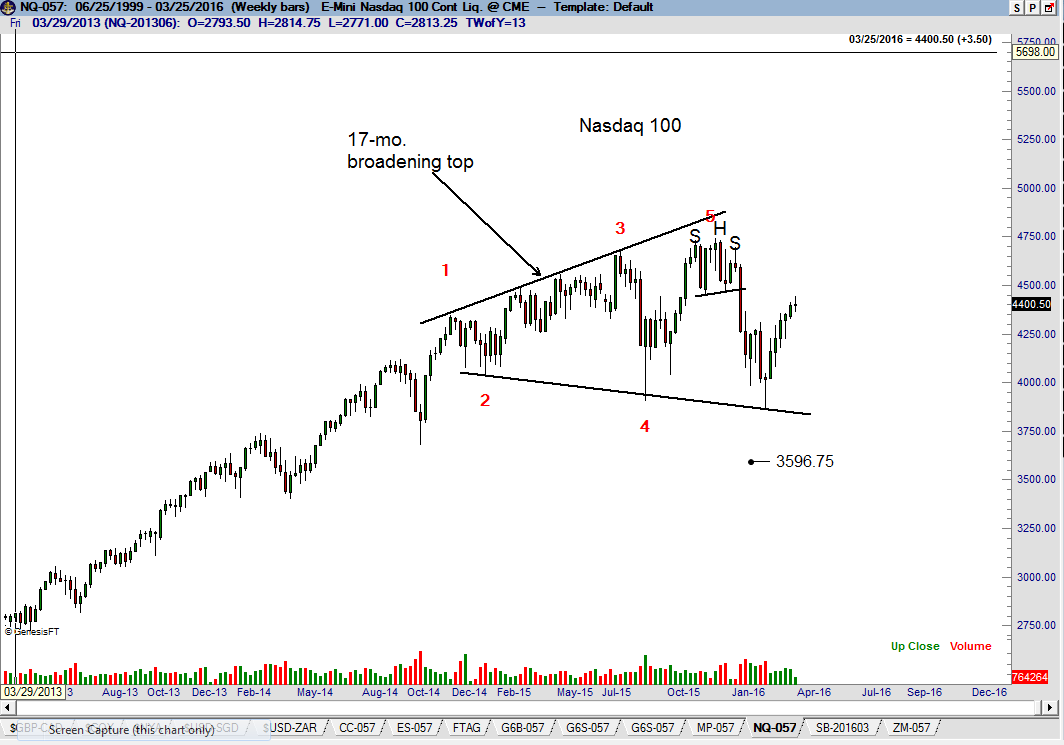
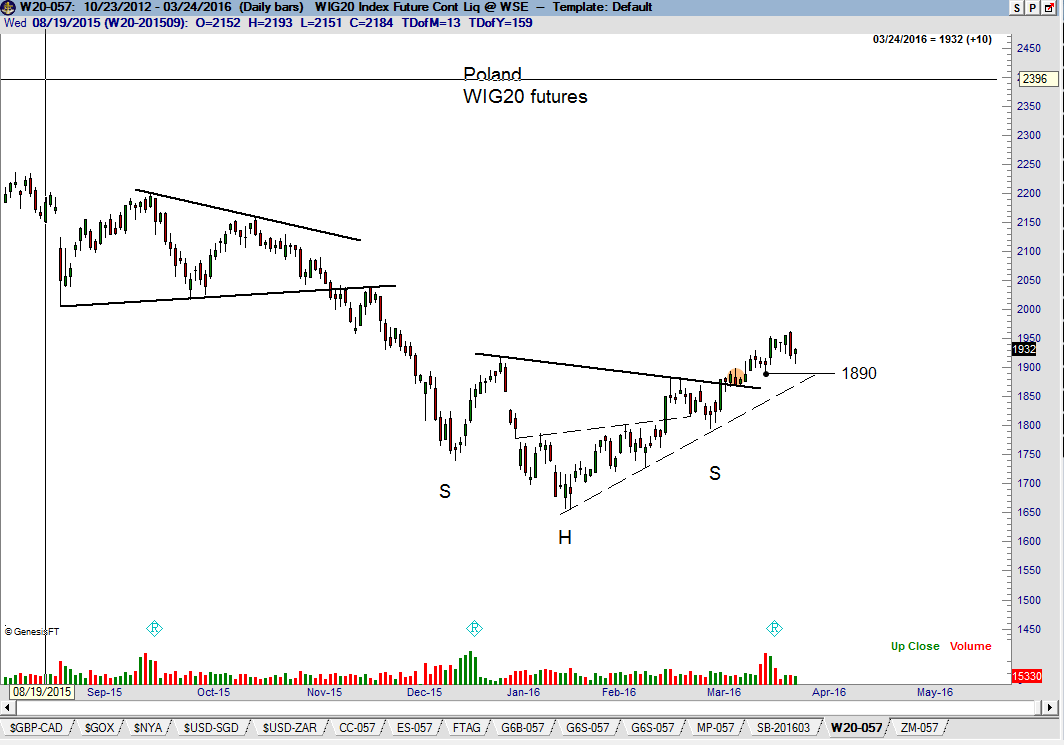
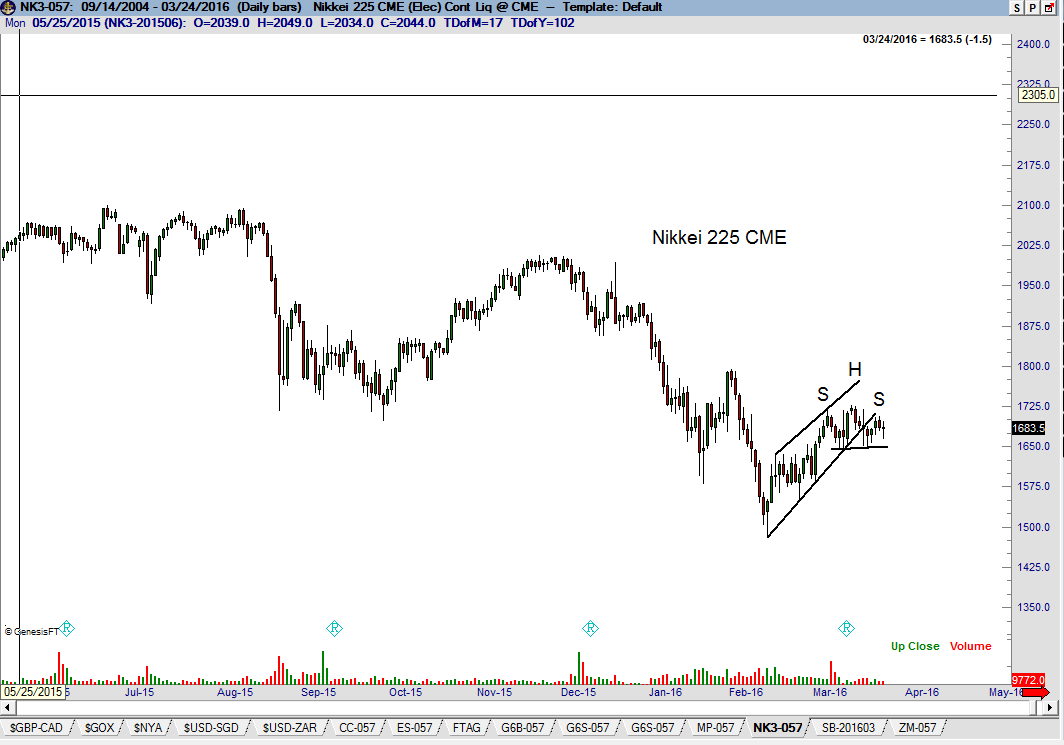
I make a point of covering the global stock markets because they are of wide interest to Factor members. Yet, for me stock indexes are just another contract to trade, no different from a forex cross, Gold, Coffee or Natural Gas. In reality, the price scale on the right hand side of a chart matters most, not the name at the top. I seek trading profits and have no interest in producing “pure Alpha.” Actually, I do have a proxy for Alpha in my trading, but that is a topic for another day. The dominant chart construction in the S&Ps continues to be the ongoing construction of a complex H&S top. The right shoulder has now become extended, and this adds doubt to the H&S interpretation. If the H&S top interpretation is correct, the market should turn down hard and turn down soon. Note that the dominant trendline from the 2009 and 2011 lows is just below the neckline of this possible H&S pattern. My bias is to monitor the daily chart for a shorting opportunity. If the H&S interpretation proves to be incorrect, then I do not have a clue what the S&P chart is all about. The Nasdaq weekly graph appears to be forming a broadening top. If this interpretation is not correct, then I am clueless on the Nasdaq as well. My only global stock index position is long the Poland Wig 20 futures, and I am not giving this trade much room to go against me. On a short-term basis, I might be interested in a short-side swing trade in the Nikkei. The trend in this index is strongly down and the daily chart displays a violated bear channel and possible small H&S top. Yet, I remain a long-term bull on Japanese equities (also a topic for another day).
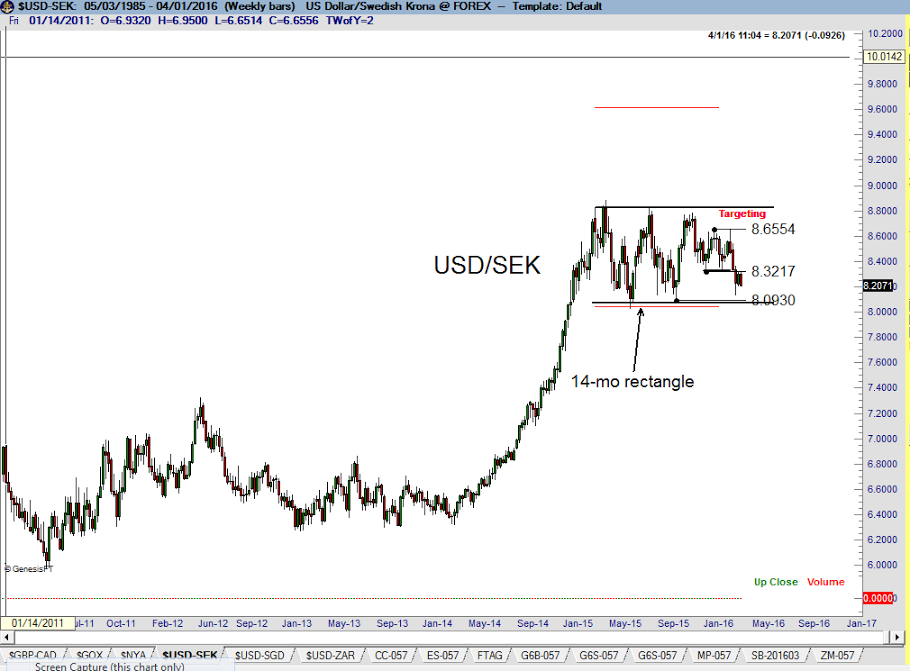
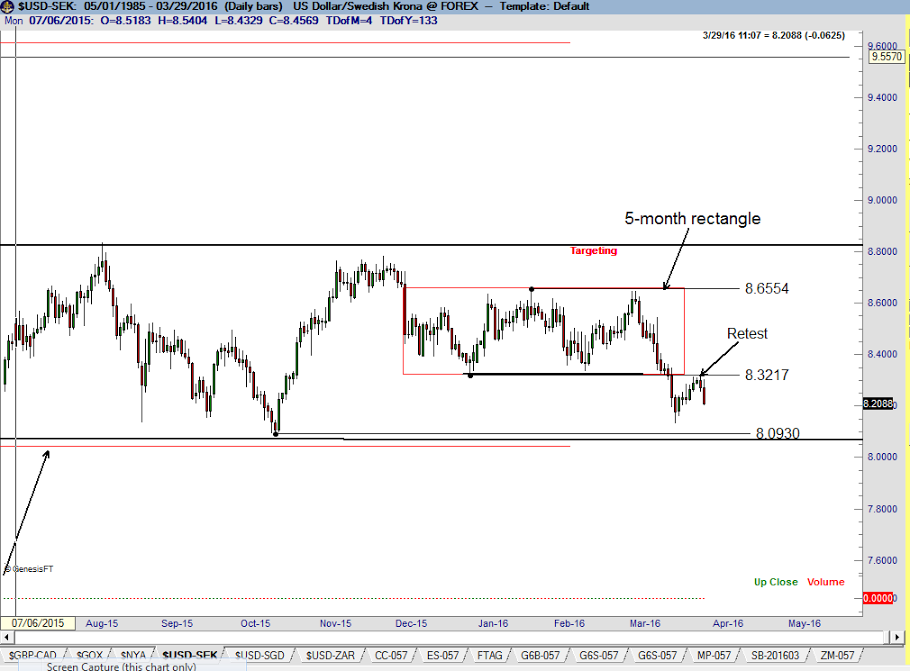
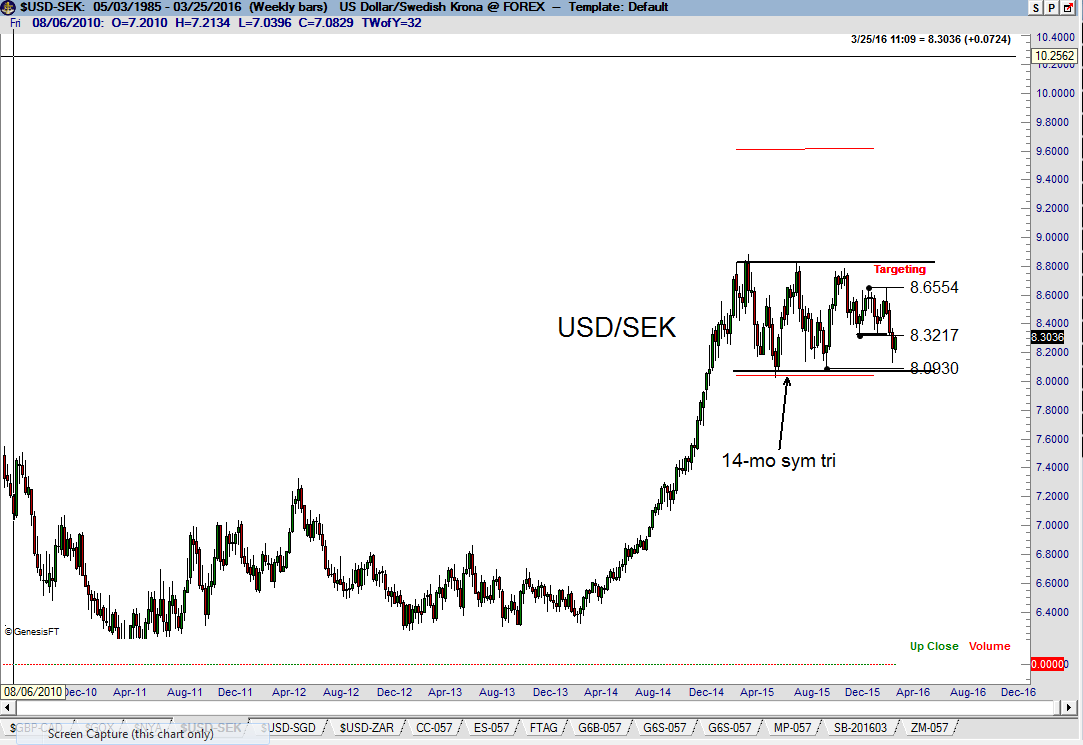
USD/SEK (weekly chart)
The weekly USD/SEK chart displays the ongoing construction of a 14-month rectangle. I am monitoring this chart with a bias toward an upside completion, consistent with my bias in favor of a bullish USD theme.
Trading Commentary
Have you ever subscribed to a research or trading service only to have it constantly remind you of its winners – quickly forgetting about its losers? The idea of only having winners (or even 70% or 80% winners) is a complete fallacy.
By contrast, I am more eager to discuss losing trades/periods than winning trades/periods – because it is the management of losing trades that will make you or break you as a trader. Unlike some market commentators and traders who only remind readers of their winning trades, I personally think more can be learned from trades and trading practices that do not work.
All traders have winning periods. And, all traders have losing periods. The real challenge is to exploit the winning periods and limit the damage during the losing periods. An even greater challenge is to keep your head and emotions in check during both types of periods. It is vital for traders to find a place and state of calm and peace within themselves if they plan to trade for a long pull.
The reality of my trading can be briefly summarized as follows on the next page:
- Historical win rate of 42% (meaning that 58% of my trades are losers)
- Average of two winning surges per year lasting two to three months each (meaning that six to eight months are either negative or do not contribute to net profitability)
- Average of two peak-to-valley drawdowns each year ranging from (5%) to (10%)
I have the strong desire to recognize, admit to and discuss losing trades and drawdown periods for a very specific reason – I want to understand the nature of the losing period. Ignoring or playing down a losing streak is a very dangerous game to play. My drawdowns can occur due to three reason:
- My specific trading approach and process may be temporarily out of synch with the markets – in other words, chart trading just does not work
- As a discretionary trader, I may be out of synch with my trading approach and process
- Both A and B may be true
I can live with drawdowns that fall under Category A (above), even though they are not fun. There have been times in the past when I’ve wondered if I would ever have another winning month. Living through a drawdown does get somewhat easier over time, but a drawdown never become a good friend. The big question I always have during a drawdown is this – am I implementing my plan or have I wandered down a rabbit trail?
Relative to Category B (above), there is always a danger for traders to become out of synch with what they do best due to multiple causes – and I have experienced the full range of such causes over the years. There have been times when I have had a very hot hand only to become careless due to over confidence. There have been times when I have become compulsive about a certain market –only to throw good money after bad. Deep drawdowns can cause a confidence crisis which can lead to all sorts of bad trading practices. Early in my trading career I would become gun shy during drawdown periods. Drawdowns can cause self-doubt, not a good state of mind for a trader. Drawdowns can lead to all forms of bad trading practices. One example might be the urge to take profits too quickly out of the fear that the profits will disappear.
During especially prolonged drawdowns there is a temptation to modify one’s trading approach. Psychologically a trader starts to think – “What I am doing does not work, so I better change what I am doing.” I have witnessed other traders who have wandered so far from their strengths that they never found their way back to the path they should have never left.
Of course, the worst of all worlds is category C above. Most often this is the cause of the deepest and most prolonged drawdown periods.
The markets have been challenging for me in 2016 to date. I was down 200+ BP in Jan, up 700 BP in Feb and am down 150 BP in Mar. I’ve had a few really good trades in 2016, including:
| · Early Jan decline in S&Ps |
· Early Feb rally in Yen |
| · Jan decline in Pesos |
· Mar rally in AUD/NZD |
| · Feb/Mar advance in CAD |
· Jan/Feb decline in Nat Gas |
But, proportionately, 2016 has been choppy. I have been involved in a number of very challenging trades, including:
- Gold market since Feb 10
- EUR/GBP (profitable, but not what it should have been)
- USD/SGD
- CHF futures
- DX futures
- USD/NOK
What are my options to respond to challenging trading environments?
- Change the way I trade in an attempt to match the market conditions. This may be an option for some trades, but it is not an option I will pursue.
- Slightly modify my trading rules to better adapt to trading conditions. This is an option I may consider, but only after serious consideration.
- Down size my leverage. This is my standard practice. During the course of a losing period I may reduce risk from 100 BP per trade all the way down to 20 or 30 BP per trade.
- Carefully monitor my emotional state. This is always necessary – even during a winning surge.
- Be diligent in trade selection – but always take quality signals, not worrying about the outcome (this is easier said than done).
- Conduct a postmortem on my risk and trade management – did I follow my rules and guidelines?
- Be patient in waiting for trading conditions to improve. I have been involved in futures and forex markets since 1975 – and trading conditions always change.
PostMortem Corner
Considering item (vi.) above, following is a postmortem of some recent trades that did not work out as planned. I feature these to provide you with additional understanding of my trading protocol.
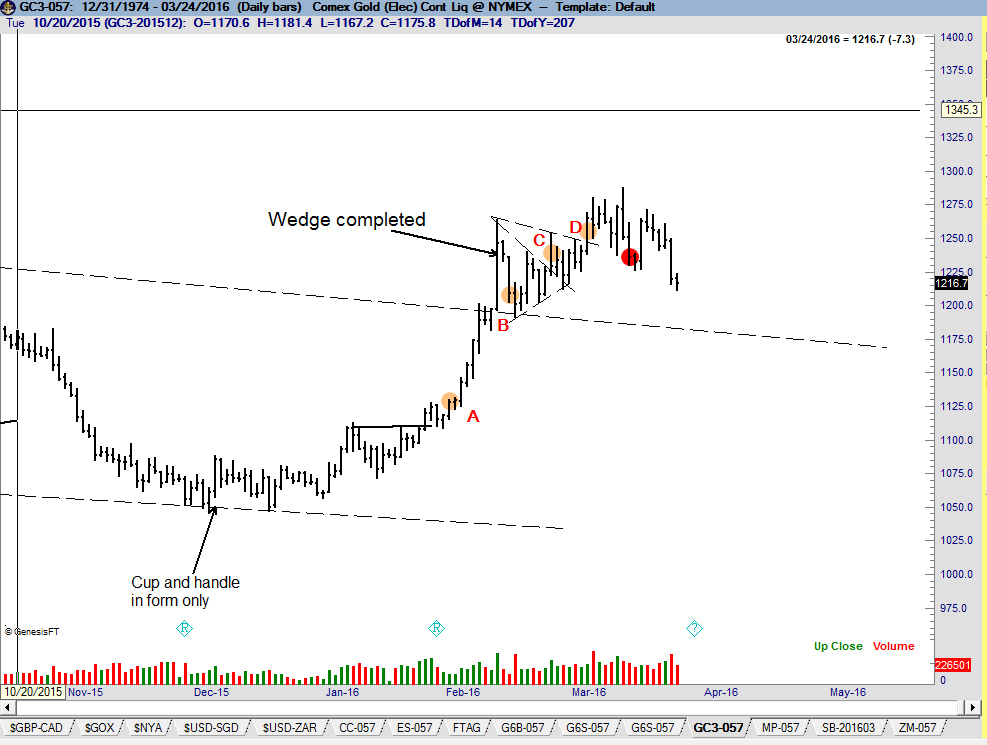
Gold – I bought a layer of Gold futures on Feb 1 (A) as the market completed what I thought was a common-turn bottom. This position worked out OK, but then the frustration started. A weekly chart wedge was completed on Feb 11. I was not willing to chase this rally, but bought another layer at 1206 on the Feb 15 pull back (B). My targer for this trade was 1390. I added another layer on Feb 24 when I thought a half-mast pennant was completed intraday (C). The market did not close well. I pitched the position on Feb 26 – I have a trading guideline to not take losing trades home on a Friday. I attempted another layer on Mar 3 (D) when the advance completed what I thought was a 3-week half-mast pennant. Half-mast pennants SHOULD result in an immediate and strong advance. This did not happen in Gold. I was stopped out of my entire position on Mar 14 (red dot) and have not attempted to re-enter the Gold market.
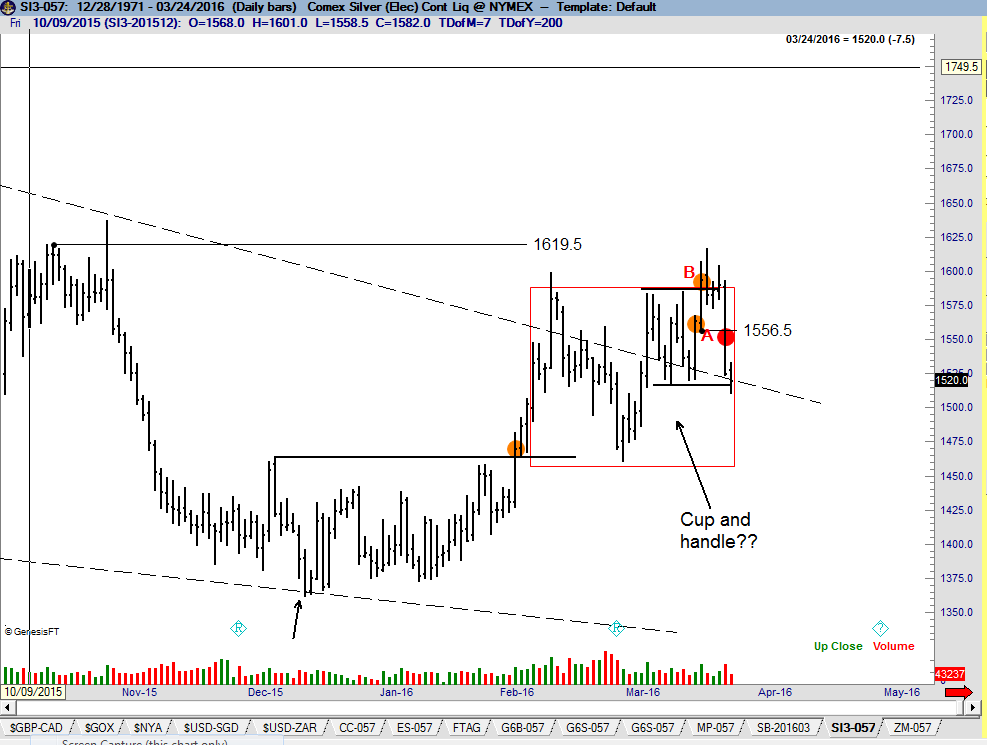
Silver – I typically do not trade Silver (poor man’s Gold), but in this case I made an exception. I viewed the period beginning on Feb 11 as a 5-week cup and handle pattern that had developed in the area of the upper boundary of a massive wedge on the weekly graph (not shown). I went long a layer of Silver futures on Mar 16 (A) and added on at the Mar 17 close (B). I was stopped out Mar 23 for a 36 BP loss. I would take this trade again without any question. It is a difficult concept to grasp, but there is a difference between a good trade and a profitable trade. I view my Silver trade as a good trade – even though it lost money.
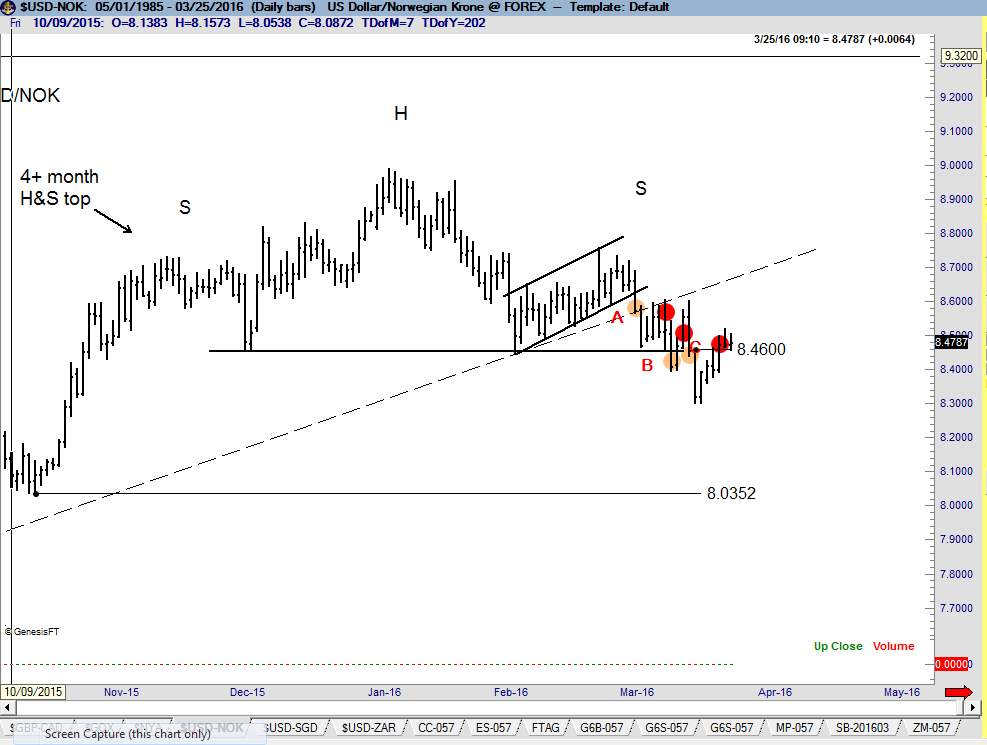
USD/NOK – I thought the H&S top was a great set up. I would trade this set up again without a second thought. I entered a layer of shorts on Mar 3 (A) as the decline sliced simultaneously through a channel I believed was the right shoulder of the H&S top and the dominant trendline dating back to the 2014 low. I was stopped out a couple days later (red dot) when I jammed my stop — incorrectly based on my trading rules. I re-entered a layer of shorts on Mar 11 (B) when the H&S top was completed. I was quickly stopped out of this layer as well. I then re-entered shorts again on Mar 16 (C) when the chart formed a bearish engulfing day. I was stopped out yet again on Mar 23. In my early years I would have become obsessed with this market – chasing every subsequent decline. But, I will not trade this pattern again. I give a pattern two attempts and then move on. I did not include the entry at point A as an attempt because it was an anticipatory position.
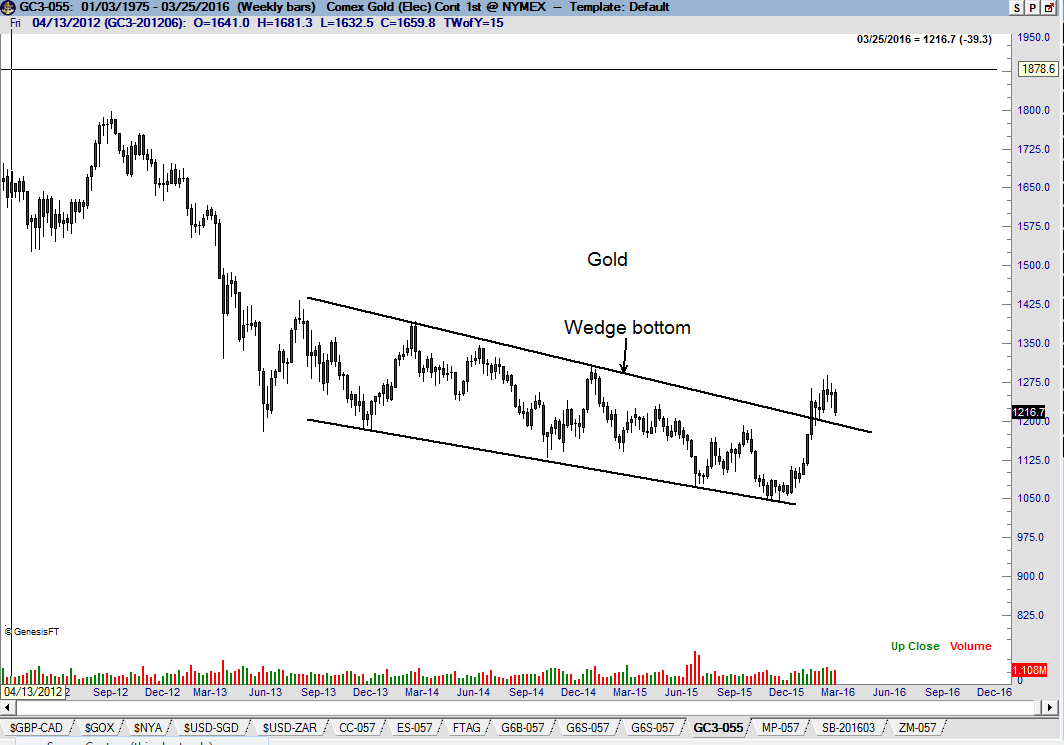
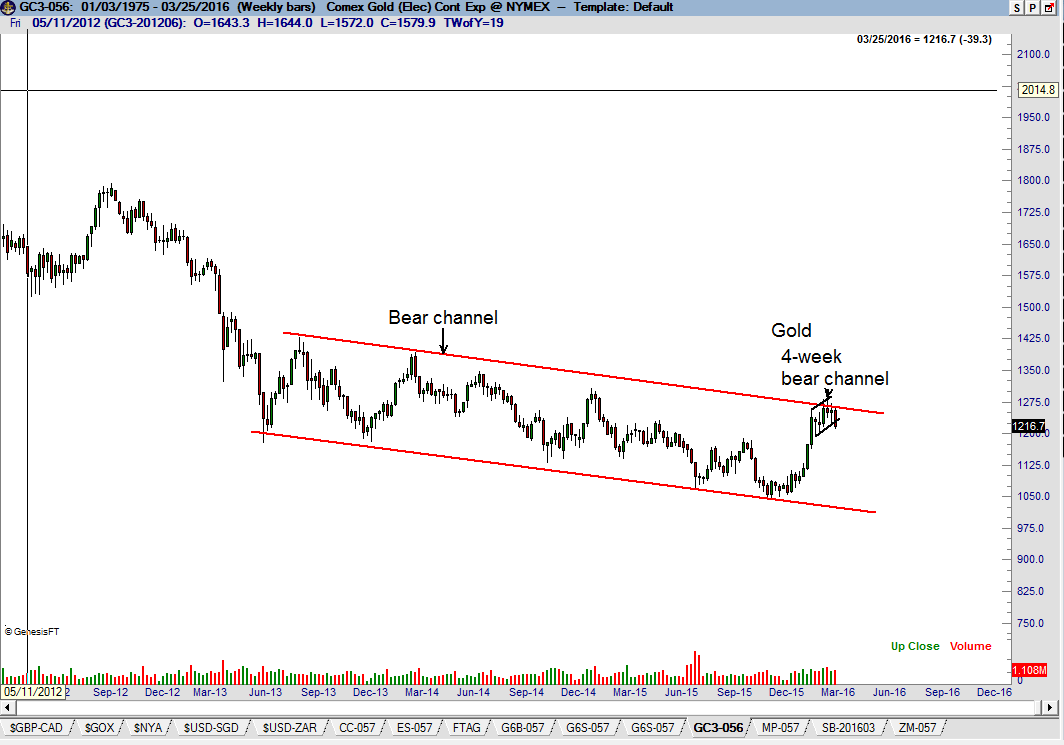
Update on Gold
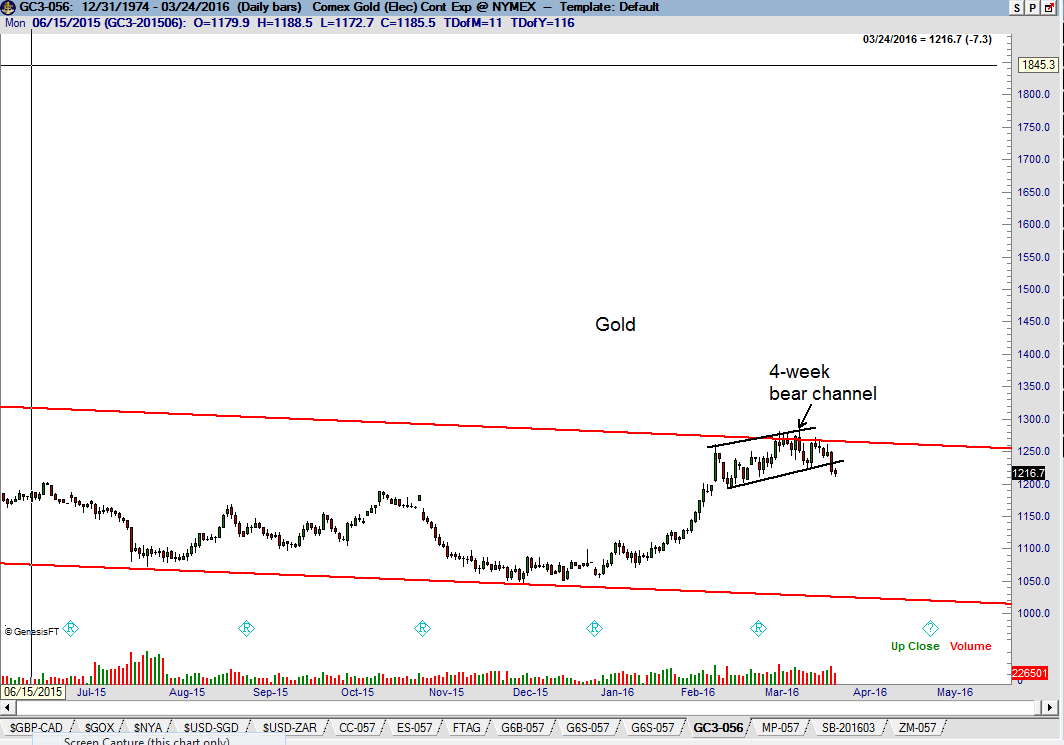
I interpreted the advance on Feb 11 as the completion of a 25-month falling wedge and the end to the bear market in Gold that began in Sep 2011. This remains my preferred opinion, but an alternative interpretation is possible, supported heavily by the inability of Gold to sustain upward momentum. It is entirely acceptable to classify the period from the Jun 2013 low as a bear channel that has not yet been disrupted (red channel lines, bottom chart). If this negative interpretation is correct, the decline on Mar 23 completed a 4-week top in the area of resistance (see daily graph, next page). Factor is flat in Gold. I am willing to short Gold (very lightly) on a rally above 1230.
plb
###