
The Public Blog site

The dominant chart construction in Cable (British Pound – GBP/USD) is the completed 30- year rectangle on the quarterly graph with a target of 1.0345 — and .7790 as an outside possibility.
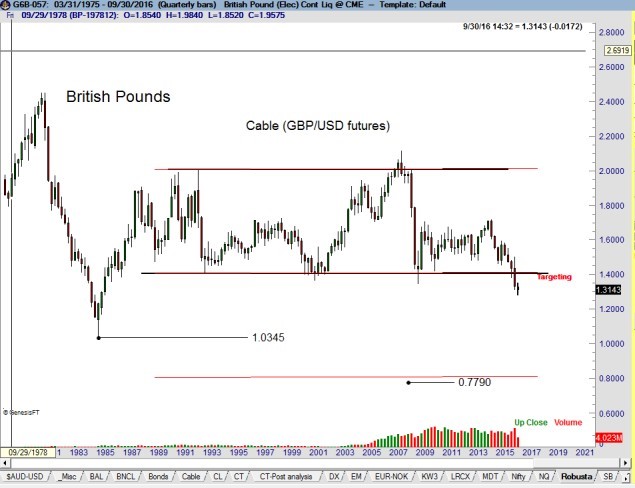
However, I will note that the Commitment of Traders data shows specs have an all-time record short position and commercials an all-time record long position in British Pound futures. This is not typically a profile consistent with a further downward trend.
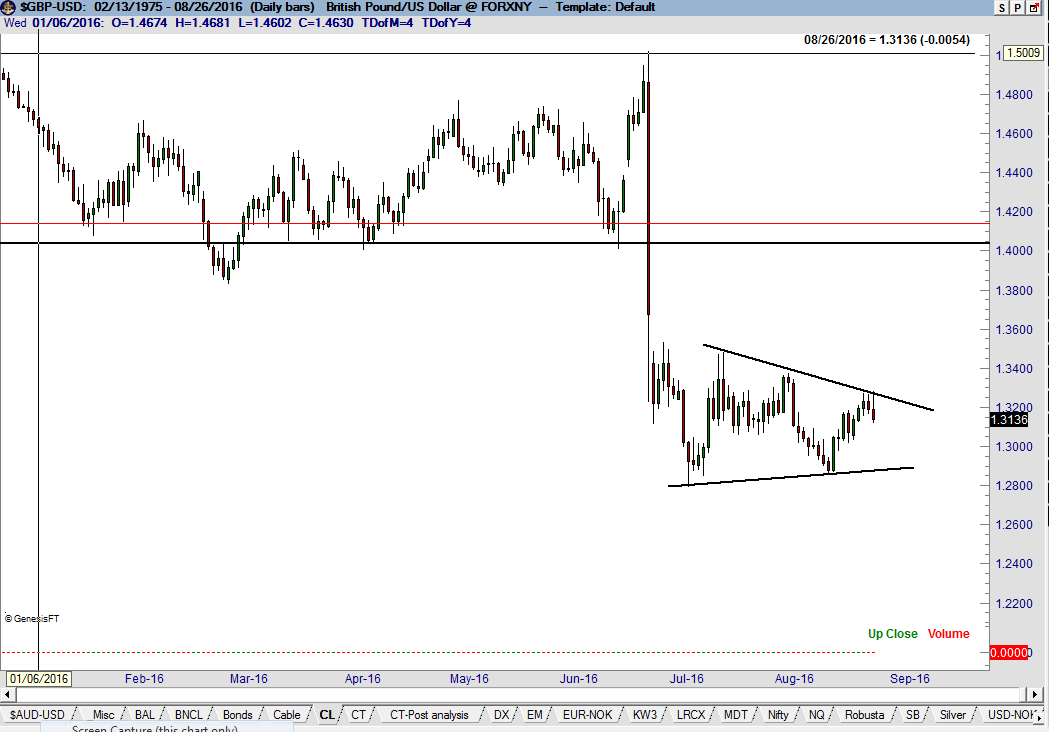
I would not be surprised if GBP/USD retests major resistance in the 1.39 to 1.41 zone. Factor is flat. If the Cable does rally toward 1.40, I will be watching closely for a selling opportunity in the way of a small topping pattern on the daily chart. There is also a chance – supported by Friday’s reversal day – that the daily chart is forming a symmetrical triangle congestion.
Factor Membership is available and you could consider your membership in the Factor Service as just one more trade. If the Factor Service is not of value to you, well, it is just one more trade that did not work. Through the Factor Service I endeavor to alert novice and aspiring traders to the many pitfalls you will face – and to offer advice on overcoming those pitfalls. My goal is to shoot straight on what trading is all about. For more information watch my 30 minute webinar where we cover the Factor service in depth.
I hope you will consider joining the Factor community.


The dream of novice market speculators is that they will continually bask in the warmth of profitable times. This myth is falsely promised by the promoters of trading systems and trading training programs. In fact, just the opposite is true. Most long-term profitable traders spend the vast majority of their trading careers either in Trading Drawdowns or recovering from a drawdown. Any slick promoter who tells you different is not dealing from a full deck.
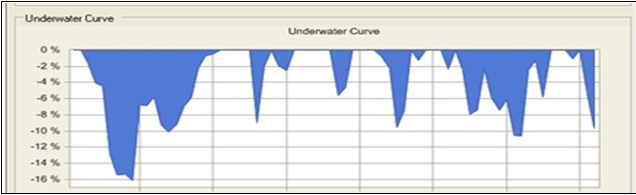
There is a statistical concept known as the “underwater curve.” The underwater curve plots the time periods when new all-time high NAV levels are being registered (represented by “0” on an underwater curve) and the time periods in which Drawdowns are either underway or in recovery back toward new all-time NAV levels.
Most successful long-term traders are underwater the majority of time. Welcome to trading!
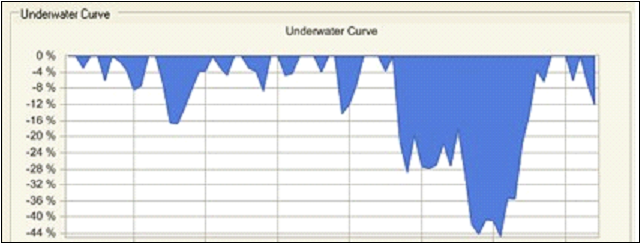
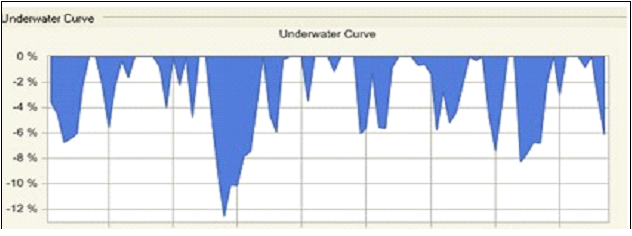
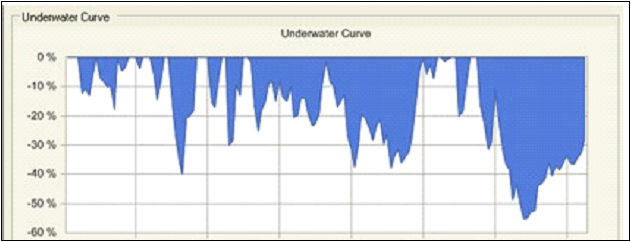
The graphics herein show the underwater tables for Factor LLC (for the period listed) and several unnamed but highly successful futures/forex trading firms (for identical 5-year periods)
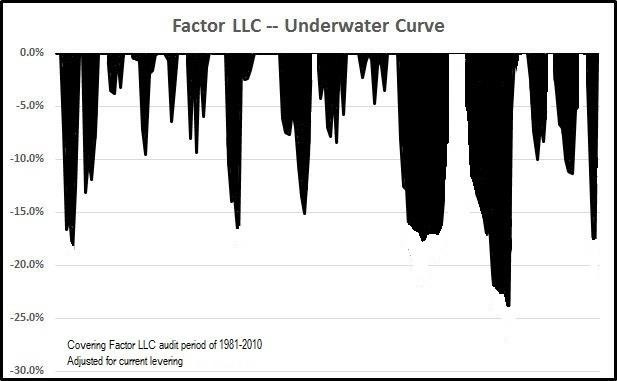
Factor LLC:
The reality is that during decades of market speculation I have spent far more time in or recovering from Drawdowns than time posting new NAV highs.
Trader A – Annual Compounded ROR (ACROR) = 20.3%, Calmar = 1.9
Trader B – ACROR = 19.4%, Calmar = .43
Trader C – ACROR = 19.4%, Calmar = 2.34
Trader D – ACROR = 18.8%, Calmar = .34
A “MUST” view is the presentation of an analysis of 180 years of market drawdowns (focused on U.S. stocks, but applicable to any and all trading operations) by Dr. Robert Frey to the Institut des Hautes Etudes Scientifiques in 2015. All serious traders and investors should take the time to understand the statistics behind Trading Drawdowns as presented in this YouTube video. Note the selected statements from the presentation to the right of Robert Frey’s photo.
Some selected statements:

Successful market speculation is one of the most challenging endeavors one can pursue. Yet, promoters of get-rich- quick-and-easy schemes run rampant in the email and internet worlds. If they are not registered with the SEC, FINRA or the CFTC/NFA or are not personally managing assets of investors they are free to make exaggerated claims. Their advertising is extremely appealing and enticing. Many of these training and trade signaling services claim to have REAL trading track records. But, as far as I am able to determine, none are willing to provide an attestation or audit letter from a national or regional auditing firm that has reconciled their IRS tax payments for trading profits, brokerage statements and bank deposits with their public claims.
Factor Membership is available and you could consider your membership in the Factor Service as just one more trade. If the Factor Service is not of value to you, well, it is just one more trade that did not work. Through the Factor Service I endeavor to alert novice and aspiring traders to the many pitfalls you will face – and to offer advice on overcoming those pitfalls. My goal is to shoot straight on what trading is all about. For more information watch my 30 minute webinar where we cover the Factor service in depth.
I hope you will consider joining the Factor community.
 Read More
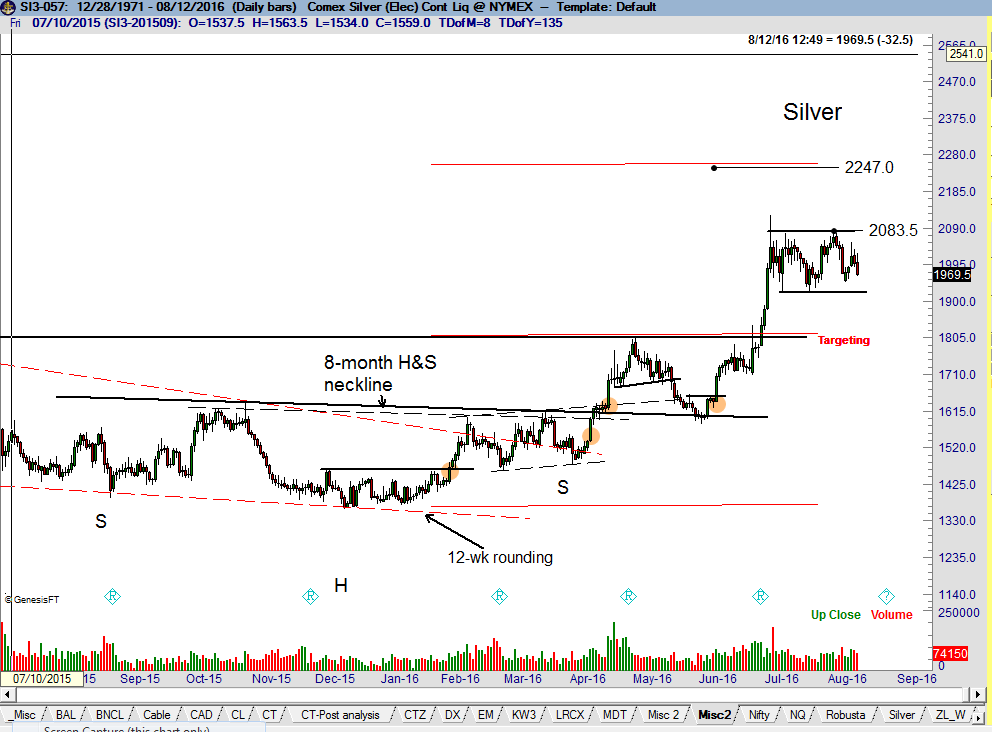
The advance in Silver is consolidating in the form of a rectangle. This consolidation could propel the market to its next Silver Target at 22.47, or lead to a retest of support at 18.00.
For more information watch my 30 minute webinar where we cover the Factor service in depth.
I hope you will consider joining the Factor community.

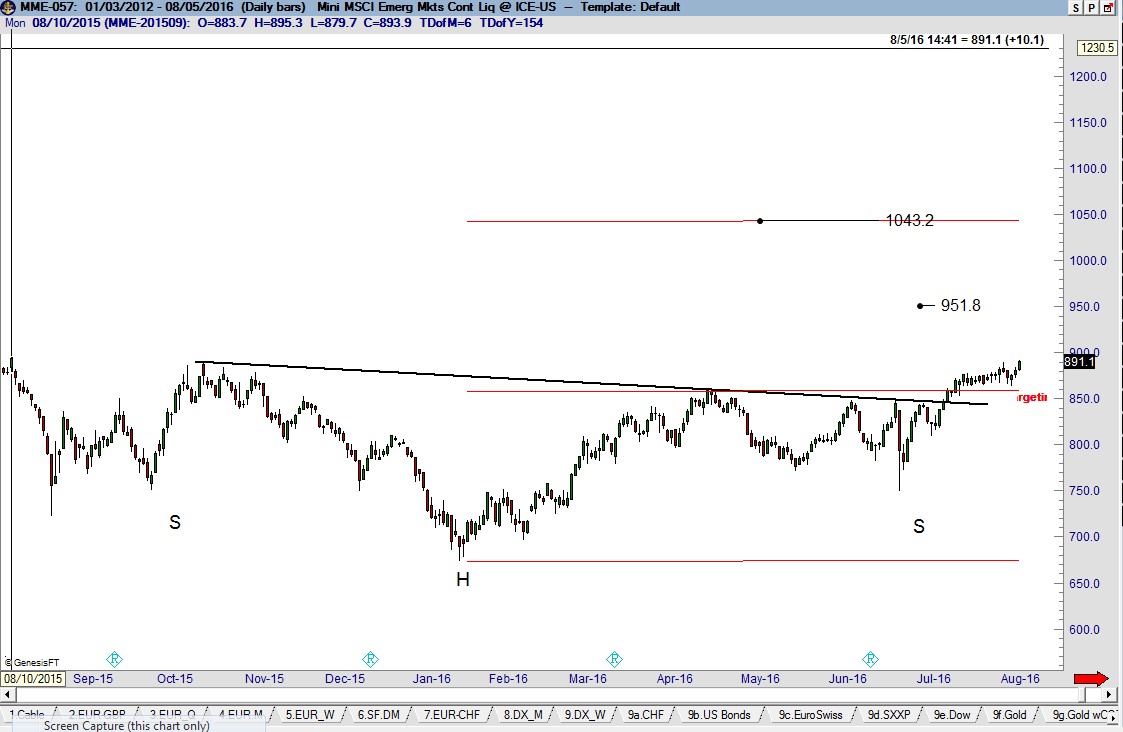
The dominant chart construction in EM futures (Emerging Markets) remains the completed 10- month H&S bottom pattern on the weekly chart wherein the final stage of the right shoulder was an independent 5-week H&S on the daily graph (red box). The initial profit target is 951 with a further potential of 1100 (Sep 2014 high). I continue to note the substantial overhead resistance on the weekly graph above 850.
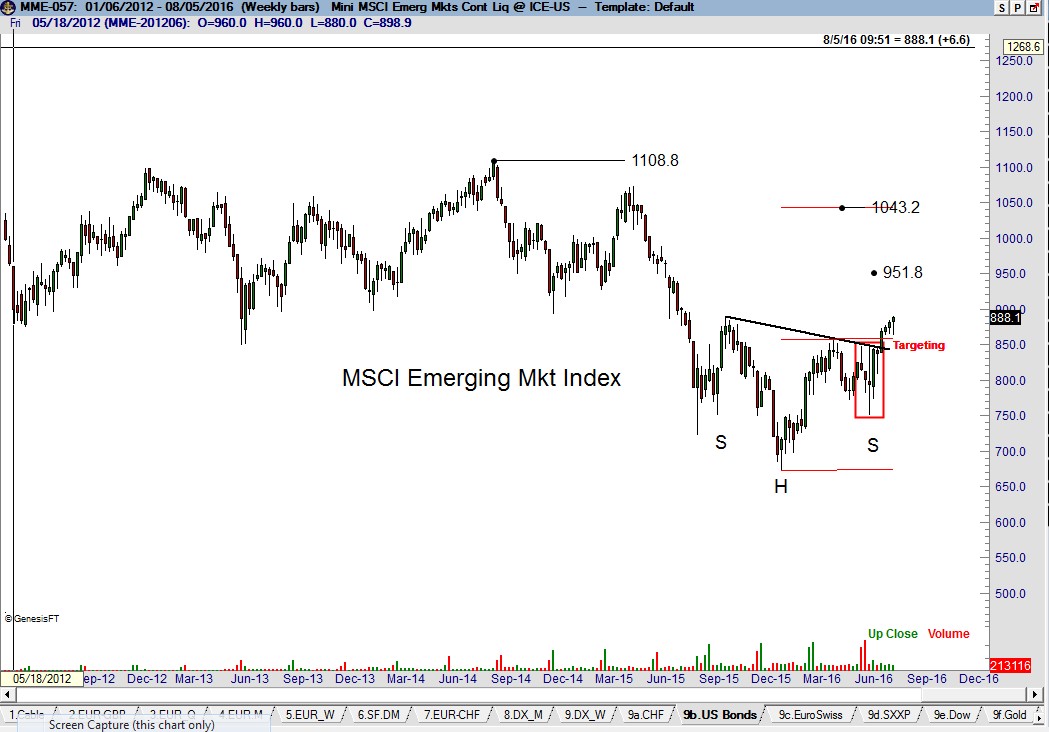
The chart of EEM-etf is also shown.
Factor Membership is available and you could consider your membership in the Factor Service as just one more trade. If the Factor Service is not of value to you, well, it is just one more trade that did not work. Through the Factor Service I endeavor to alert novice and aspiring traders to the many pitfalls you will face – and to offer advice on overcoming those pitfalls. My goal is to shoot straight on what trading is all about. For more information watch my 30 minute webinar where we cover the Factor service in depth.
I hope you will consider joining the Factor community.

Too many traders have an obsession with Winning Trades. I hate to be the bearer of bad news to some of you, but taking losses is the primary job description of a market speculator. If Losing Trades offend you or upset your emotional chemistry, if you consider “being wrong” to be a character fault or a “problem” with your trading approach, if you even think that the marketplace cares what you think or what you do, then market speculation is probably not for you. Trading is mostly an exercise of throwing mud against the wall to see what sticks – and most lumps of mud fall quickly to the floor. I have known many extremely profitable career traders over the years and very few of them have a win rate in excess of 50%. Almost to a person, these traders view taking losses (many losses) as the process of finding winners.
I am not offended by being wrong on a market call – it is absolutely not a big deal to me. It is always an amusement to me when tweeters go out of their way to remind me of bad market calls. To be a successful profit taker, a trader must first become good at taking losses. Sorry – both profits and losses are part of trading. I know of no other service similar to the Factor that provides a frank discussion of losing trades, losing days, losing weeks, losing months and even losing years (I have experienced several net losing years along the way). I am in no way embarrassed to be wrong on my market analysis or on trades.
If Losing Trades and being wrong bothers you then trading is not for you. If you become obsessed with Winning Trades and making money back in the same stock, forex pair or futures contract in which you lost capital, then you need to seriously examine if you should be involved in market speculation.
Factor Membership is available and you could consider your membership in the Factor Service as just one more trade. If the Factor Service is not of value to you, well, it is just one more trade that did not work. Through the Factor Service I endeavor to alert novice and aspiring traders to the many pitfalls you will face – and to offer advice on overcoming those pitfalls. My goal is to shoot straight on what trading is all about. For more information watch my 30 minute webinar where we cover the Factor service in depth.
I hope you will consider joining the Factor community.

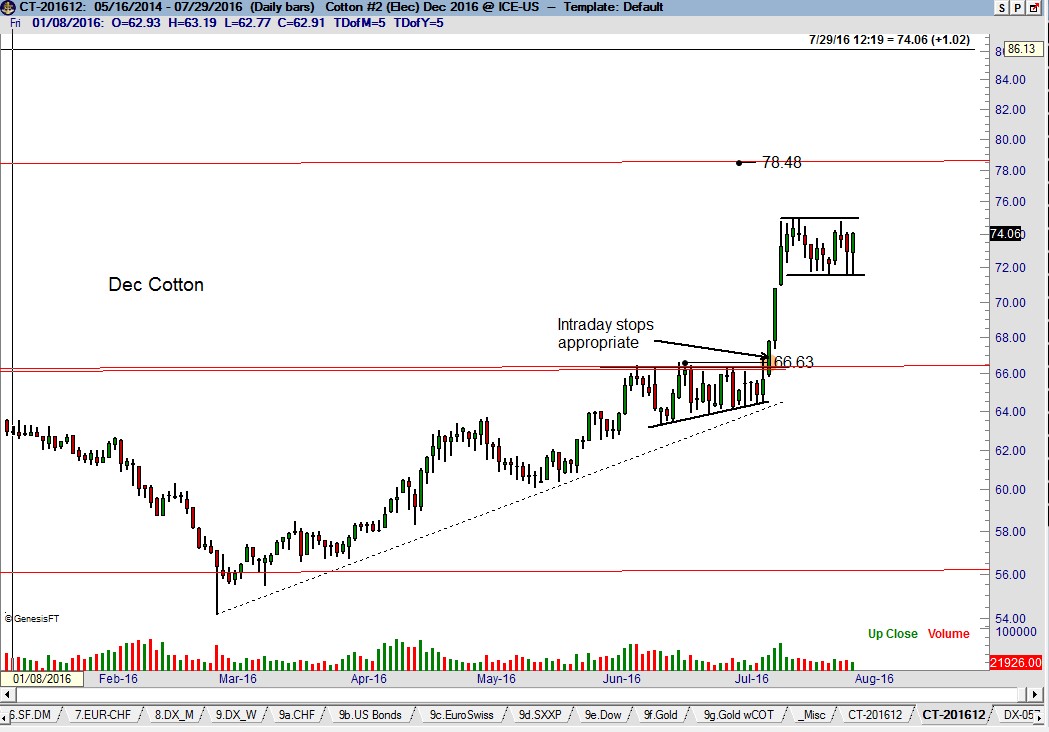
The dominant construction on the Cotton Chart continues to be the completed 24-month double bottom on the weekly Cotton Chart. The targets of this bottom are 79.10 (the measured move) and 95.10 (May 2014 high). The Dec contract was launched by a 5- week pennant. Factor is long, having taken partial profits.
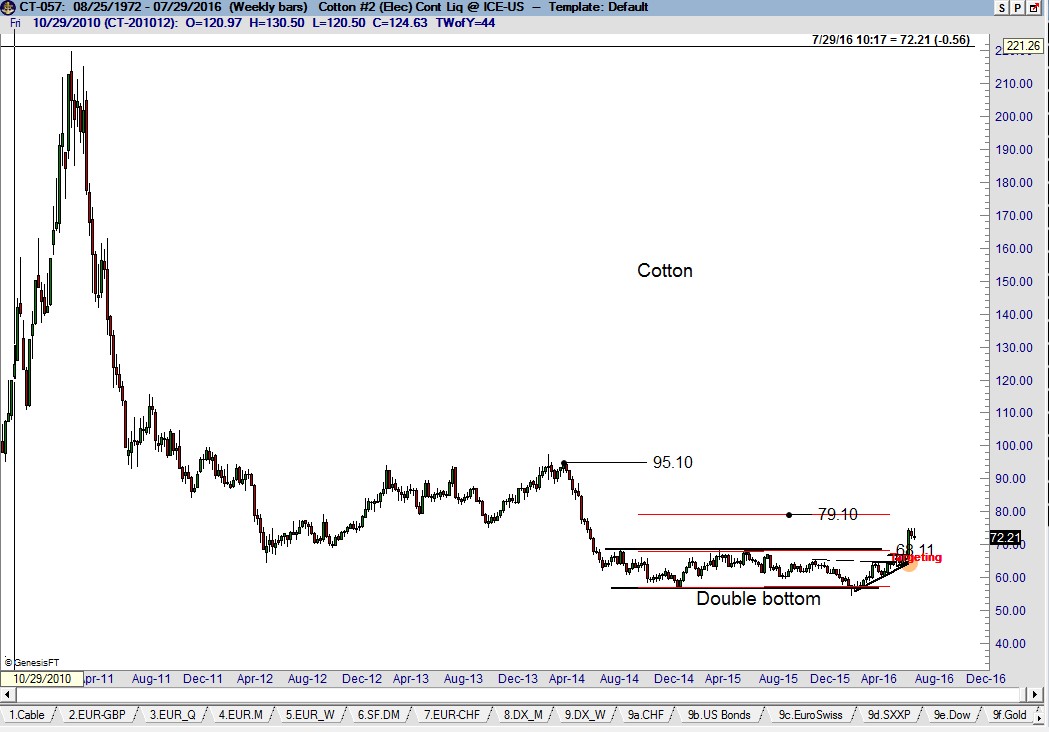
Cotton Chart – The market appears to be forming a small 2-week pennant – I am willing to increase my leverage based on this pattern. However, a longer period of congestion or even a sizable correction would be very normal given the magnitude of the Jul 11-13 advance. A decline back toward 71.00 to fill the Jul 13 gap cannot be ruled out. There is no reason at this time to believe the period since the Jul 13 high will become part of a topping pattern.
Factor Membership is available and you could consider your membership in the Factor Service as just one more trade. If the Factor Service is not of value to you, well, it is just one more trade that did not work. Through the Factor Service I endeavor to alert novice and aspiring traders to the many pitfalls you will face – and to offer advice on overcoming those pitfalls. My goal is to shoot straight on what trading is all about. For more information watch my 30 minute webinar where we cover the Factor service in depth.
I hope you will consider joining the Factor community.

15% of my trades –
At the end of the year, these special trades are all that matter. These are the BOTTOM-LINER trades.
85% of my trades –
At the end of the year, the results of these trades just do not matter, but how they are managed matter much. These are the JUNKPILE trades.
As a trader I have always been interested (one might say “obsessed”) with data. I view myself as a data-driven trader. I am incredibly fortunate to have kept data on many aspects of my trading since founding Factor Trading Co., Inc. at the Chicago Board of Trade in 1981. This abundance of data provides me with a deep understanding of numerous benchmarks and metrics of my trading and risk management protocols. I did not begin collecting data thinking that someday the data would become extremely valuable in understanding the dynamics of a trading program – I collected the data because I have always loved data. Nevertheless, the data have become precious.
Since the inception of Factor I have remained primarily a classical chartist. Yet, the prism through which markets are viewed is one thing – actual trading tactics are an entirely different thing. While continually a chartist, my trading tactics have evolved through the years for various reasons (subject of another day). By tactics, I mean such things as:
During the 1980s and early 1990s, I traded approximately 25 to 30 signals per month. From the mid-2000s through early 2014, I traded about 20 signals per month. Since early 2014, I have thought more in terms of trading themes than individual trading signals – in reality, I may have several signals in a given market under the umbrella of the same trading theme. My view of a “trade” is broader now than it was in the past. From early 2014 throughthe present I have been engaged in about 8 to 10 trades (themes) per month. My goal is to move toward only five themes per month.
How do I define a trading theme? This question is best answered by some recent examples. In my mind, long Silver and long Platinum were expressions of one trade, long Meal and long Beans were part of one trade and two attempts at long GBP were part of the same trade.
My profit goal is 35% per year – knowing that some years will greatly exceed this figure and losing years are possible. My goal is to move toward 50 trades per year. Let’s use the 50 trade figure as an example for a case study.
Based on my historical benchmarks, 50 trades will result in the following:
Let me translate the data above into basis point equivalencies. Remember, 100 basis points (BPs) equals 1% of total nominal trading capital.
Assume that I trade an average of 8 futures contracts per $1M of nominal capital. [Keep in mind that the actual size – depending upon the market traded and the specific chart set up – may range from 3 to 25 contracts per $1M of capital.] The equivalent size in spot forex would be a position valued at approximately $800,000 per $1M of nominal capital (even if the USD is not a pair within a specific forex trade).
Let me now translate this data into the USD result per futures contract (or spot forex equivalent as cited above).
In my experience, there are only two tactical solutions to produce the data above:
Let me unpack item #2 above in more detail. A trade with an initial risk of 60 BPs (see Tracking Account spreadsheet for examples) represents a stop of about $750 per futures contract (or FX equivalent). My job as a trader is to shrink this potential loss as quickly as possible. To do so, I must attempt to adjust my risk level within a day or two after trade entry. The goal is to move stops to insure a break-even trade within a week.
I really want all Factor members to understand this concept – my real focus is the 15% of trades that hopefully establish a profitable bottom line at the end of a year. I refer to these as BOTTOM-LINE TRADES. This means that 85% of my trades are throw away trades – or, what I refer to as JUNK-PILE TRADES. This concept explains why an individual trade is relatively unimportant to me. An individual trade is simply a data point in a series of data points. It is unimportant if a trade is a profit or loss as long as:
This was Part one of a three part series, titled: Bottom-line winners and junk-pile trades
Part 2 of this series focuses on Bottom Liners.
Part 3 of this series focuses on the Junk Pile of lesser profits and losers.
Part 2 and 3 are available to members of the Factor Service only.
Factor Membership is available. For more information watch my 30 minute webinar where we cover the Factor service in depth.
Different approaches to trading should result in different statistical profiles. The graph below displays the distribution of the Factor’s monthly RORs over the years. The distribution of monthly RORs shown on the graph are very consistent with the summary of Factor’s trading strategy and tactics explained on the previous page.
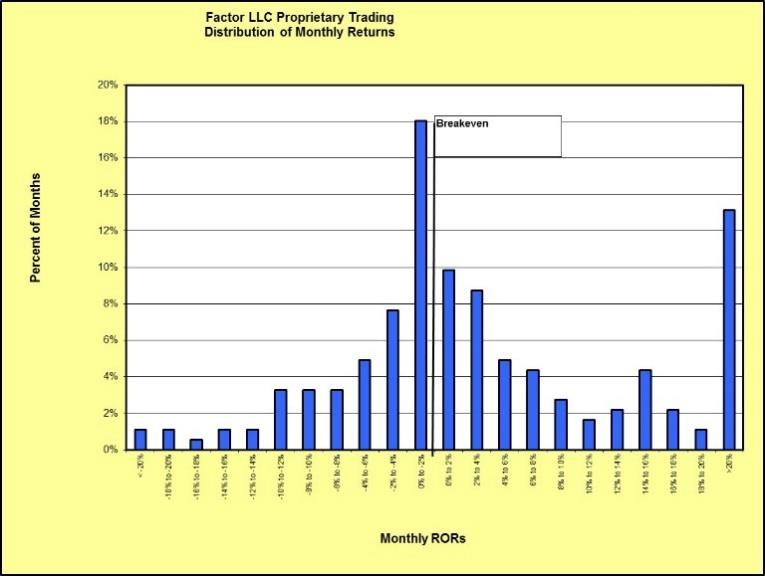
In an average year (keeping in mind that an average year is a statistical event – in reality, there are no average years), five months will be breakeven months (-2% to +2%), three months will be losing months (>-2%) and four months will be winning months (>+2%) of which one to two months will reside in the right-handed outlier column.
The profile of monthly RORs will be very different for different trading approaches. For example, short-term mean reversion trading approaches typically will not have right- or left-handed outliers, but will squeeze into the middle with the highest column being a small winning month.
Drawdowns are an inevitable part of trading. There are some industry-accepted metrics related to the expectation of drawdowns for discretionary traders such as myself. Drawdowns must be taken into account when analyzing risk-adjusted performance.
The investment industry is obsessed with the Sharpe Ratio – which is, in my opinion and the opinion of most other proprietary traders I know – about the most worthless measure of trading performance invented by mankind. The fact the investment community is so obsessed with Sharpe is a confirmation of the lack of sophistication within the wealth management industry seeking to “manage” the capital of private investors. The best source of information on trading metrics can be found in Jack Schwager’s book, “Market Sense and Nonsense.”
There are two metrics I consider to be most important in appraising risk-adjusted performance – the Calmar ratio and the Gain-to-Pain ratio.
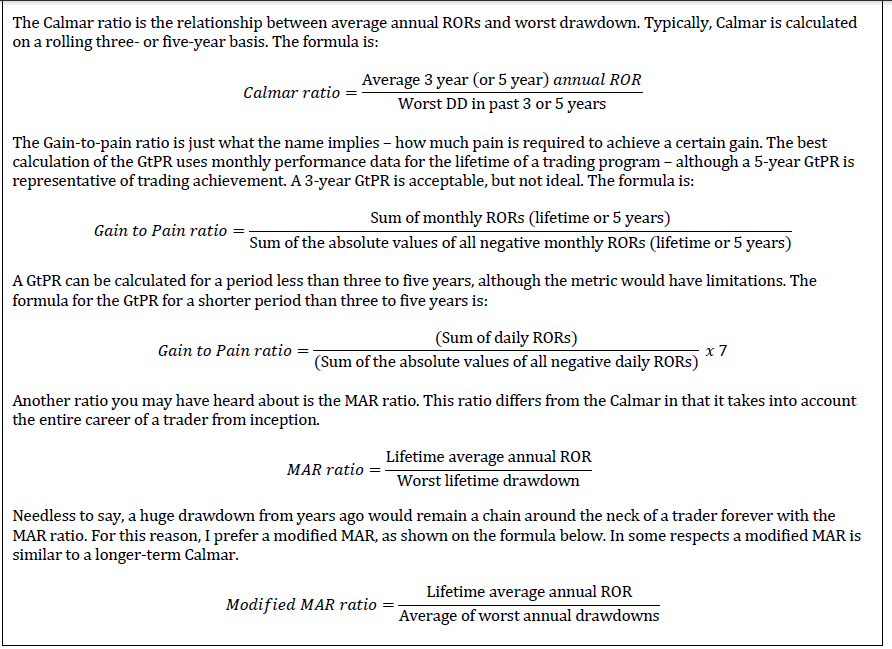
For both Calmar and Gain-to-pain ratios, a value greater than 1.0 is considered to be quite good, above 1.5 is considered to be very good, above 2.0 is considered to be excellent, above 2.5 is excellence-on-steroids, and above 3.0 is world class. Anything above 1.0 to 1.5 for MAR is excellent.
Based only on audited years, the Factor’s MAR is 1.3, modified MAR is 2.6, and GtPR is 2.5. Calmar is a metric that all traders should be aware of because it places upside performance into a proper perspective. A rolling Calmar of 1.5 (which is very good) suggests that a trader seeking a performance of 24% per year should expect annual drawdowns in the area of (16%).
Drawdowns are the curse of a trader. I have been through many drawdowns in my career and they do not get easier. The challenge of a trader is to ride through these drawdowns, preserving both financial and emotional capital. To do so, a trader must constantly remained grounded in the foundational truths of his or her trading program.
Foundational truths include some of the following aspects:
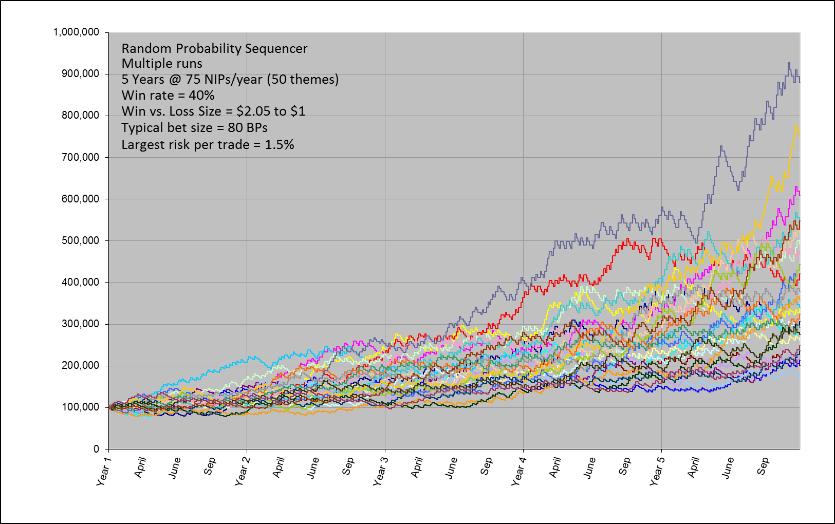
The longer a trader has traded a basic approach (allowing for some evolution along the way), the more intimate a trader will become with his or her trading approach and its moods and inclinations. I have a huge advantage on this score, having traded classical patterns for a living since 1981. I have both an instinctual and statistical sense of my trading approach. When N equals a large number (N being the number of trading events experienced by a trading approach), statistical benchmarks become more stable. My benchmarks are quite stable when projected over a multi-year time frame. The graph below displays a NAV over a five year period produced by a random-number generator. I have run thousands of sequences since being part of the small group of traders who developed the Excel program used to perform this analysis. The graph below shows only 30 sequences.
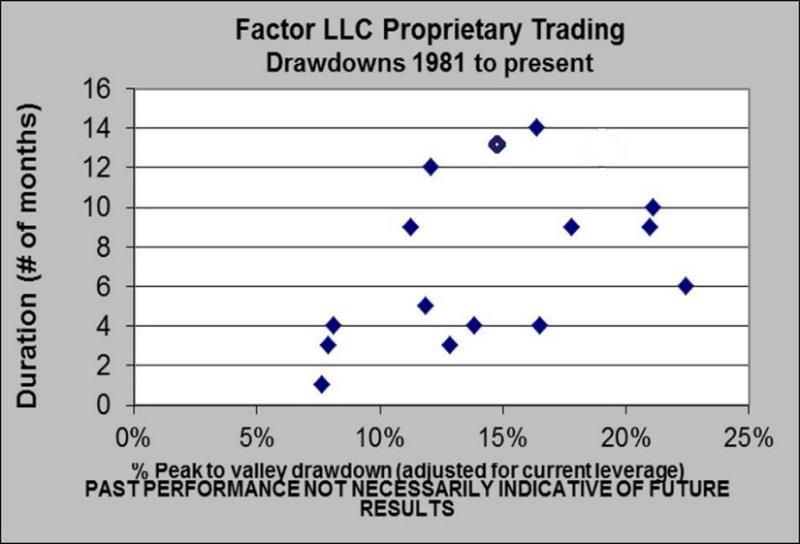
Statistically I also know the probabilities of various drawdowns. For example, I know that annual drawdowns of approximately minus 9% to minus 17% have a probability within a single standard deviation. The table below is based on my historical benchmarks. I have made some changes in the past two years to trade management protocol in an attempt to push the skew of the STDs to the left. Exploration aimed at this goal continue.

I completely understand that many of you do not have a solid grasp on the statistical probabilities of their trading approaches – and, in fact, too many Factor members do not even have a firmly articulated trading plan. This is why I encourage developing traders to go slow. Bet small, have realistic expectations and make capital preservation Job #1 until some of these other facets of trading gain clarity.
This was Part one of a three part series, titled: Bottom-line winners and junk-pile trades
Part 2 of this series focuses on Bottom Liners.
Part 3 of this series focuses on the Junk Pile of lesser profits and losers.
Part 2 and 3 are available to members of the Factor Service only.
Factor Membership is available and you could consider your membership in the Factor Service as just one more trade. If the Factor Service is not of value to you, well, it is just one more trade that did not work. Through the Factor Service I endeavor to alert novice and aspiring traders to the many pitfalls you will face – and to offer advice on overcoming those pitfalls. My goal is to shoot straight on what trading is all about. For more information watch my 30 minute webinar where we cover the Factor service in depth.
I hope you will consider joining the Factor community.

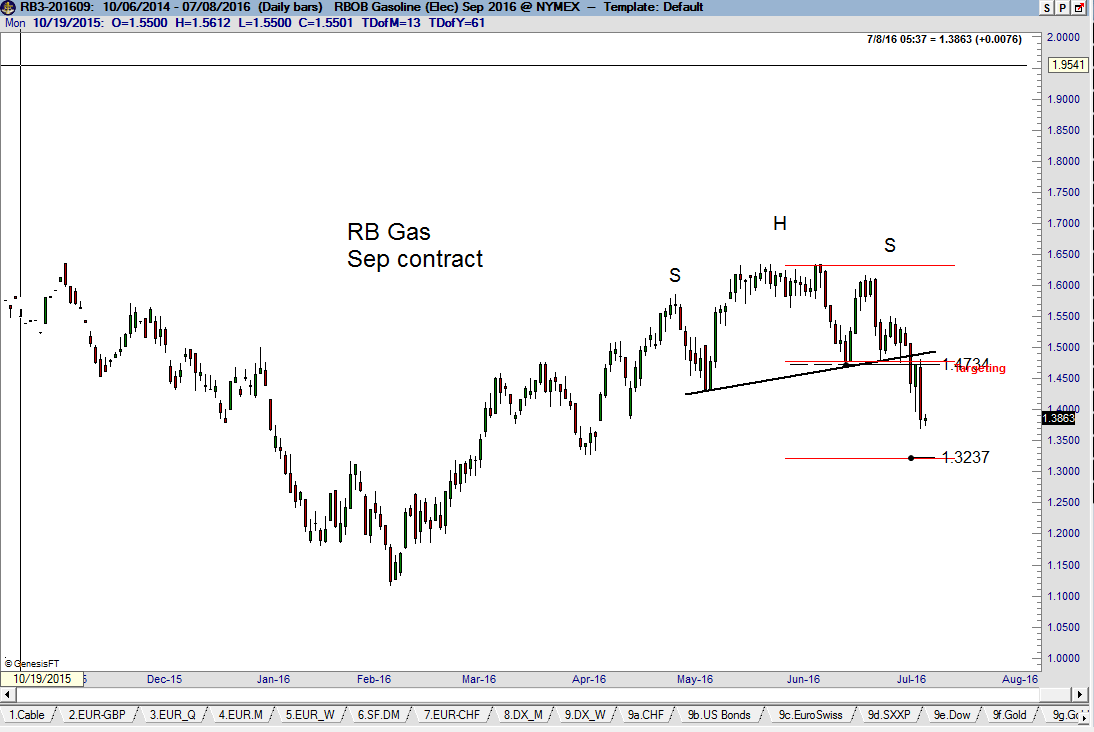
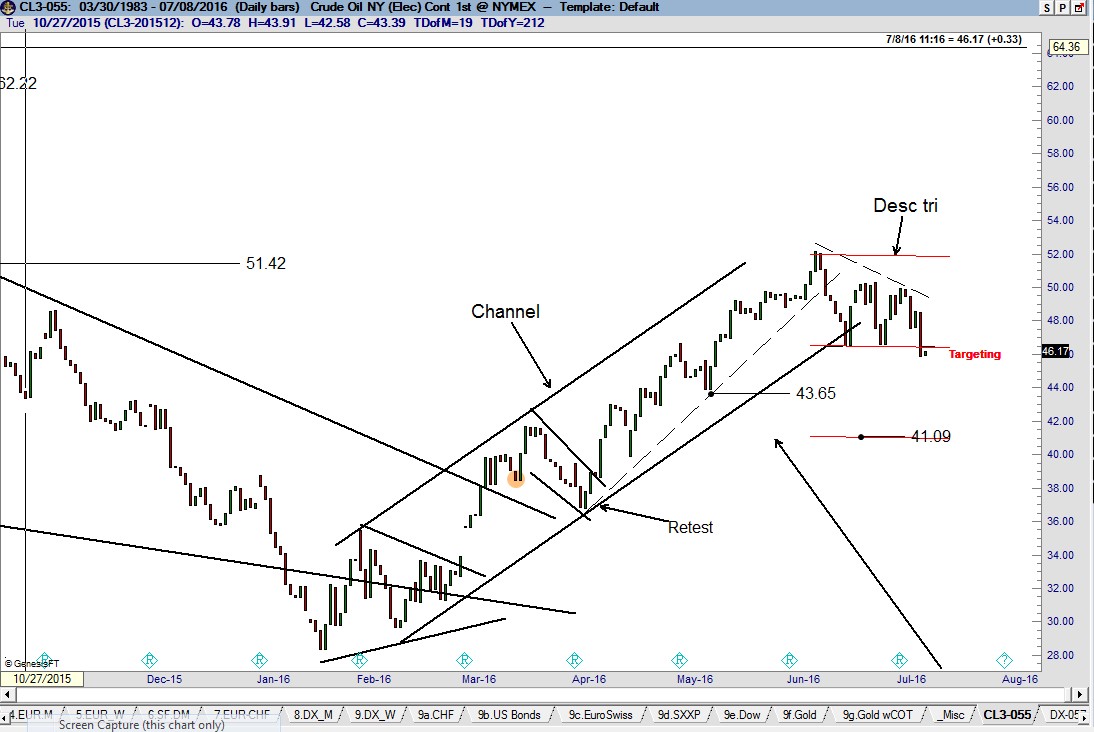
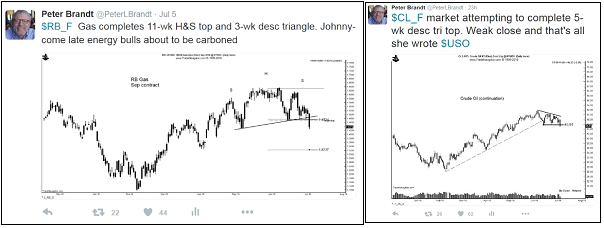
Crude Oil is descending out of a triangle pattern. The daily graphs show clear signs of topping in the energy markets. The daily graph of Sep RB Gas has completed an 11-week H&S top pattern with a target of 1.3237.
A couple of observations on daily continuation graph (true range) of Crude Oil are worthy of note. First, the 5-month up channel from the late Jan lows has been clearly violated. The breaking of an advancing trendline (lower boundary of a channel) is never a bearish signal in and of itself. Trendline breaks are simply an indication that the behavior of a market is changing. Second, the Crude Oil decline on Jul 7 completed a small descending triangle top with a target of 43.65, then 41.09. Factor is short Crude Oil.
Factor Membership is now available where trade setups such as Crude Oil are just one of numerous themes in focus each week. You could consider your membership in the Factor Service as just one more trade. If the Factor Service is not of value to you, well, it is just one more trade that did not work. Through the Factor Service I endeavor to alert novice and aspiring traders to the many pitfalls you will face – and to offer advice on overcoming those pitfalls. My goal is to shoot straight on what trading is all about. For more information watch my 30 minute webinar where we cover the Factor service in depth.
I hope you will consider joining the Factor community.
![]()
