
The Public Blog site
 Read More
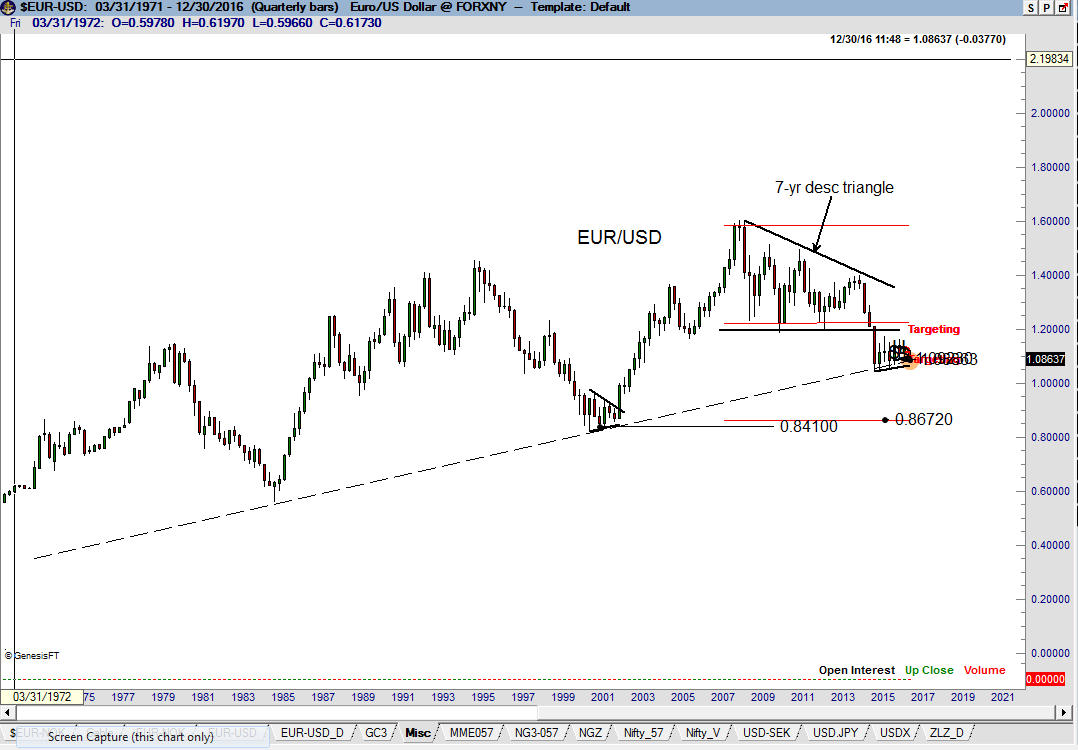
The Yen Chart is a textbook charting market – it has a long history of providing very reliable pattern signals, as shown on the weekly chart dating back to early 2011.
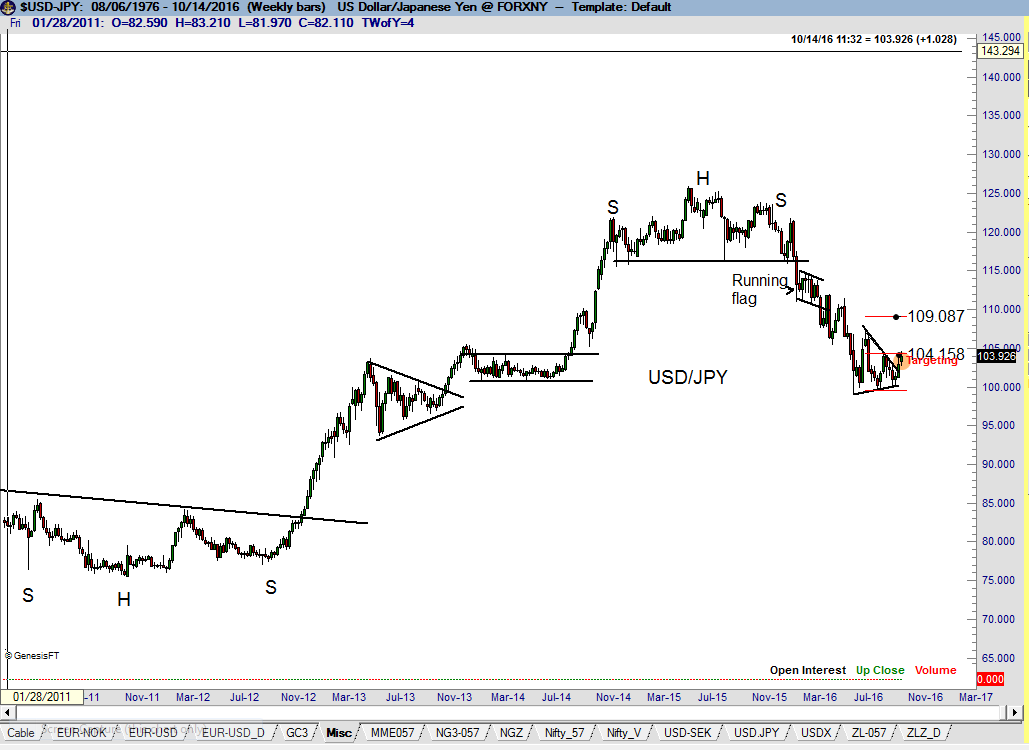
The advance on Oct 4 appears to have completed a possible 16-week symmetrical triangle bottom – remember that the symmetrical triangle pattern is far less reliable than horizontal patterns such as the H&S, rectangle and right angle-triangles. In order to be confirmed, a breakout of a symmetrical triangle bottom needs a decisive close above the last intermediate high in the triangle – marked as point #4 at 104.32 on the daily graph. A confirmed breakout on the Yen Chart would have a minimum target of 109.
.
Peter Brandt is a 40+ year veteran of trading. Through his Factor Service, members receive:
You could consider your membership in the Factor Service as just one more trade. If the Factor Service is not of value to you, well, it is just one more trade that did not work. Through the Factor Service I endeavor to alert novice and aspiring traders to the many pitfalls you will face – and to offer advice on overcoming those pitfalls. My goal is to shoot straight on what trading is all about. For more information watch my 30 minute webinar where we cover the Factor service in depth.
I hope you will consider joining the Factor community.


Trading and the U.S. healthcare system — these are the two issues for which I am most passionate about. Trading — because it is how I made and continue to make my living. The healthcare system — because a major accident in 1984 has made the cost and delivery of healthcare a focus of my life.
This blog was originally posted on March 12, 2012 during the height of the U.S. national debate over healthcare reform and Obamacare. With the increasing awareness and recognition that Obamacare is a failure (with a few exceptions) and the likelihood that Hillary Clinton will once again bring forth an agenda to overhaul the healthcare system, I think it is important to reprint the March 2012 blog post in its entirety.
Nothing has changed. The U.S. has by far the most expensive healthcare system in the world (47% more expensive per capital than Switzerland, the second most expensive healthcare system in the world). One would expect that for its price tag the U.S. has a gold standard for healthcare outcomes. Think again!!!
The outcomes of the U.S. healthcare system are NOT in the same league with other Developed Countries — they are far more comparable to Third World countries.
As president, Hillary Clinton will push hard for a single-payer system — but her proposals will not address most of the reasons the U.S. healthcare system will remain Third World. In fact, I am in favor of a single-payer system in the U.S., but not without a complete overhaul of the big pharma, big insurance, big tort and big government mandates.
March 2012 blog post:
As a country, approximately 18.2% of our GDP is devoted to healthcare spending. Switzerland and France (#2 and #3) spend respectively 12.3% of 12.0% of their GDP for health care. The U.S. spends the second greatest amount of GDP for health care among all members of the United Nations, topped only by East Timor.
For its money, the U.S. obtains health outcomes that are near the bottom of the OECD rankings, and, in fact, rival some of the outcomes of Third World countries.
From extensive experience with the U.S. health care system as a medical patient, and in-depth research of the counterpart systems in other developed countries, I can confidentially say that by nearly every measure the U.S. is a failure.
Unfortunately, Obama Care from its very inception addresses few of the flaws within the U.S. health care system. In fact, if anything, the mandates of Obama Care worsen our nation’s health.
As the U.S. Supreme Court begins its hearings today on the constitutional challenge against Obama Care, I would like to share with you what I have experienced and learned during my 28 years of reliance on this nation’s health care system.
I find it beyond belief that the U.S. Supreme Court will pass final judgment using legal arguments on a health care system that has already been declared a failure on its own merit.
The remainder of this post summarizes my personal experience with the U.S. health care system and some vital statistics on its world class expensiveness and failed health outcomes.
My anecdotal experiences
On August 26, 1984, while sleepwalking at 2 AM, I took a “Peter Pan” onto a concrete slab 18 feet below the railing of the deck out our bedroom sliding door. That it was a rude awakening is an understatement. That I did serious damage to my spine is more of an understatement. I ended up in the hospital for 42 days and spent 6 months in a full hard body cast. In the process I needed to relearn the skills of walking and conducting many other routine aspects of living.
At the time of my accident I lacked health insurance. I paid every last cent of my medical bills during the ensuing two years.
During the past 28 years I have: (A.) navigated a burdensome and overly complex and health care delivery system; (B.) endured four major spine surgeries and countless radiological tests and other medical procedures; (C.) relied repeatedly on the false promises of big pharma; and, (D.) pursued numerous experimental and trial treatment protocols. In the process I have learned first-hand how difficult, complicated and expensive U.S. health care system is to navigate. Anyone reading this post whom has experienced an undiagnosed or complicated chronic medical condition knows exactly what I am talking about.
Of course, we hear everyday how the U.S.health care system is the best in the world. Nonsense! Our health care system is a patchwork created by special interest groups (especially “big pharma”) and political ideology, not by the medical needs of a nation. For relatively healthy U.S.residents, the American health care system is superb. But, get really chronically ill and you will find out what the octopus is really like.
Let the data tell the story
I was raised to believe that trees and plants can be judged by the fruit they produce. Good trees produce good fruit, bad trees produce bad fruit. I was raised to believe that facts speak louder than words. So, what are the facts related to the U.S. health care system
Costs
Outcomes
There is nothing in the Obama Care model that will improve the cost/outcome performance of the U.S. health care system. NOTHING!

So, what works?
There are health care models that provide superior outcomes for far less expense (as measured on a percent of GDP basis or cost per person).
The consensus in the U.S. (especially among political conservatives) is that the Canadian and the U.K. health care systems are not the direction the U.S. should go. From my research, I agree entirely. But I disagree completely with my conservative brethren that the government should not play a major role in the health care system. In fact, I believe the U.S. government has a major role to “serve,” just not the role it is presently “playing.”
The countries with the most promising health care systems include Japan, Taiwan, Singapore, Germany, Switzerland, France, the Netherlands, and the Scandinavian countries. By all measures (cost and health outcomes) these countries smoke the U.S. And, contrary to what political conservatives say, the doctors in these other countries are not all trained at U.S.medical schools.
Yet, the majority of the countries cited above tend to be more racially, educationally, socially and economically homogeneous than the U.S. population. Except France! France has more diversity in these measures than the other comparative countries. While wide social, economic and racial diversity does complicate health care delivery to some degree, the problems with the U.S. model are systemic, foundational and political.
The French health care system, while far from perfect, is greatly superior to the U.S. health care system by most measures. It is unacceptable in politically conservative circles to compliment France for anything. Yet, data on the following table speak for themselves.

This harsh critique of the U.S. heath care system is by no means an indictment againts all health care services in this country. My personal search for sane, cost efficient and quality health care services was finally fulfilled when I first visited the Mayo Clinic in Rochester, MN. The Mayo and a few clinics like it, such as the Cleveland Clinic in Ohio, understand how to conduct cost-effective medicine and care for its patients. I applaud the Mayo. I owe whatever qualify of life I now have to the Mayo. I only wish I lived in southern Minnesota.
What few people know is that the Mayo and Cleveland Clinics, along with a few other providers who “get it” provided members of Congress with their own version of health care reform during the original debates. Their proposals and the cost savings they would have brought to this country were research based and verified by the Wharton School of Management.
Unfortunately, it was politics as usual and the Mayo model did not see the light of day in Washington.
Summary
It really does not matter how the U.S. Supreme Court decides on the issue of mandated health insurance. This component of health care is like a fly feeding on the carcass of a dead elephant.
The health care system in the U.S.has already been tried in the courts of “cost” and “outcome” and been found guilty on all counts.
Additional tables that tell the tape
These tables are based on slightly old data, but they still demonstrate the point.
[scribd id=86793940 key=key-24twhk1tjv9uw33hojyk mode=list]
#SCOTUS
###
.


Let me guess two things from the question. First, my guess is that the drawdown was deeper than it should have been and that it consisted of at least several trades that went from initial profits into losses. Because of this fact he is now fearful of present profits turning into losses. Second, my guess is that the member had not as buttoned up on rules and guidelines for managing open trades as he would like to be – and this fact makes it easier to second guess the outcomes of each and every trading event.
He asked if this situation ever happens to me. The answer — When doesn’t it happen to me? Welcome to the world of Trading Psychology and discretionary trading. I wish I could sound brilliant in answering the question, but unfortunately the war he describes is not one for which I will ever claim complete victory. Human emotions are the biggest enemy a trader faces. This is one reason I am so critical of the self-proclaim “geniuses” who peddle trade identification and win rates as the pinnacle of trading achievement. Unfortunately, there are no easy answers to this dilemma – and each discretionary trader must find ways to win individual battles within the larger war against self. I am not even sure that the specific “peace treaties” I have negotiated over the years with my inner enemies are the best solutions for all other traders.
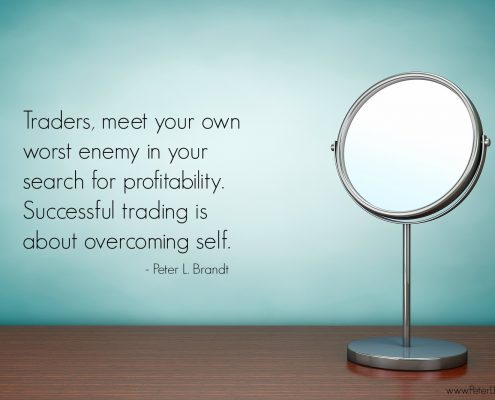
Overcoming self and mastering Trading Psychology is an individual struggle – this is why consistent long-term traders have developed a tremendous and unbiased awareness of self. When I came into the trading business in the mid-1970s there was a saying around the Chicago Board of Trade that went something like this … “If you want to know yourself – all your insecurities, character faults, issues of pride, areas of greed or selfishness, unresolved traits, etc. – just become a trader. How true! Self-awareness and managing the Human Side of Trading is a hallmark of every great trader I have known over the years.I can describe some of the steps I have used to create a peace treaty with fear, false hope and greed.
Traders who do not have specific trade management rules and guidelines face the biggest emotional turmoil because it becomes so easy for them to second-guess every decision – and this leads to the vicious cycle:
The reality of trade management is that rules, guidelines and decisions CANNOT be optimized. If you come up with all the answers to this trading dilemma, please let me know.
Peter Brandt is a 40+ year veteran of trading. Through his Factor Service, members receive:
View your Factor Member options here.
You could consider your membership in the Factor Service as just one more trade. If the Factor Service is not of value to you, well, it is just one more trade that did not work. Through the Factor Service I endeavor to alert novice and aspiring traders to the many pitfalls you will face – and to offer advice on overcoming those pitfalls. My goal is to shoot straight on what trading is all about. For more information watch my 30 minute webinar where we cover the Factor service in depth.
I hope you will consider joining the Factor community.

Here at Factor, we receive so many great questions covering Risk Management, Trade Management, Classical Charting Principles, The process of Trading, and the Human Aspect of Market Speculation. As followers of our public blog, we wanted to share just a handful of these Q&A’s with you.

Answer: A continuation graph plots the price of the “front” or nearest futures contract on a rolling basis. I use several types of continuation charts – each different based on when the chart rolls from the nearby contract to the next contract.
-055 – rolls on the first day of the expiration month
There are several things a trader needs to understand about continuation graphs.
(About turning $50,000 into $1,000,000) You are very critical of the promoters of trading systems and training programs that offer promises of huge profits. I share your criticism. Yet, surely you know some traders who have turned $50,000 into $1,000,000 in a matter of a few years. If so, how did they do it?
Answer: I personally know some traders who have achieved this type of profitability. Yet, there are some things all aspiring traders need to understand about 10-fold and 20-fold profitability. First, I know no trader who has achieved this level of profitability with a system or trading approach. Such levels of profitability come from ultra-leverage in very substantial and sustained one-off trends – not by applying day trading techniques learned from a $3,000 trading video. Second, the leverage and risk taken to achieve this level of profitability represent a two-sided coin. I cannot recall a single trader who has achieved a 10-fold or 20- fold return during less than a five year period who has not also experienced at least one 50% drawdown in the process. Herein lies the dilemma – and a question. If you, as a trader, ran a $50,000 account into $1,000,000, then experienced a drawdown back to $500,000, which frame of mind would you have:?
A. You just made $450,000 – what a fabulous thing
B. You just lost $500,000 – what a bummer
There is another dimension to a 10- or 20- bagger that I must mention. A big trading score requires far more than the desire to make it happen, perseverance, incredible patience, discernment, boldness and the right trading tactics. It requires the right markets at the right time in a trader’s career – and that is largely a function of luck. Without the intervention of providence no amount of desire/boldness/trading tactics will make it happen.
Answer: Great question. I am highly data driven and believe the data I have collected on my trading performance over the years is a small gold mine. The metrics I maintain include (but are not limited to) the following.
These are the metrics I believe really matter to performance outcomes.
Answer: Even though I have based my trading on classical charting principles since 1980, the tactical aspects of my trading have evolved over time. There are several areas of my trading today that are modified vs. 2011 – the year “Diary” was published.
Trading frequency – Back in the 1980s and early 1990s I typically made 25 to 30 trades per month. At the time “Diary” was published, my monthly trading frequency had declined to 15 to 20 trades per month. My present goal is to enter no more than 10 trades per month.
Pattern Selection – My focus is on horizontal patterns. While I will trade an occasional symmetrical triangle or wedge, these patterns must meet additional criteria.
Pattern Duration – At the time of “Diary,” I considered patterns of 4 to 10 weeks in length. My focus now is on patterns 10 to 20 weeks in duration. I will trade a smaller pattern if it is part of a larger pattern – either as a launching pad or continuation pattern.
Trade Management – I am much less likely to retain my initial stop levels. I make every attempt to as quickly as possible move a trade to a breakeven proposition.
Factor Members enjoy a monthly live Q&A session with Peter Brandt. They’re also encouraged to send in their questions at any time. The Factor maintains a database of these member Q&A’s on the website so all members can learn from this interaction.
Factor Membership is available and you could consider your membership in the Factor Service as just one more trade. If the Factor Service is not of value to you, well, it is just one more trade that did not work. Through the Factor Service I endeavor to alert novice and aspiring traders to the many pitfalls you will face – and to offer advice on overcoming those pitfalls. My goal is to shoot straight on what trading is all about. For more information watch my 30 minute webinar where we cover the Factor service in depth.
I hope you will consider joining the Factor community.


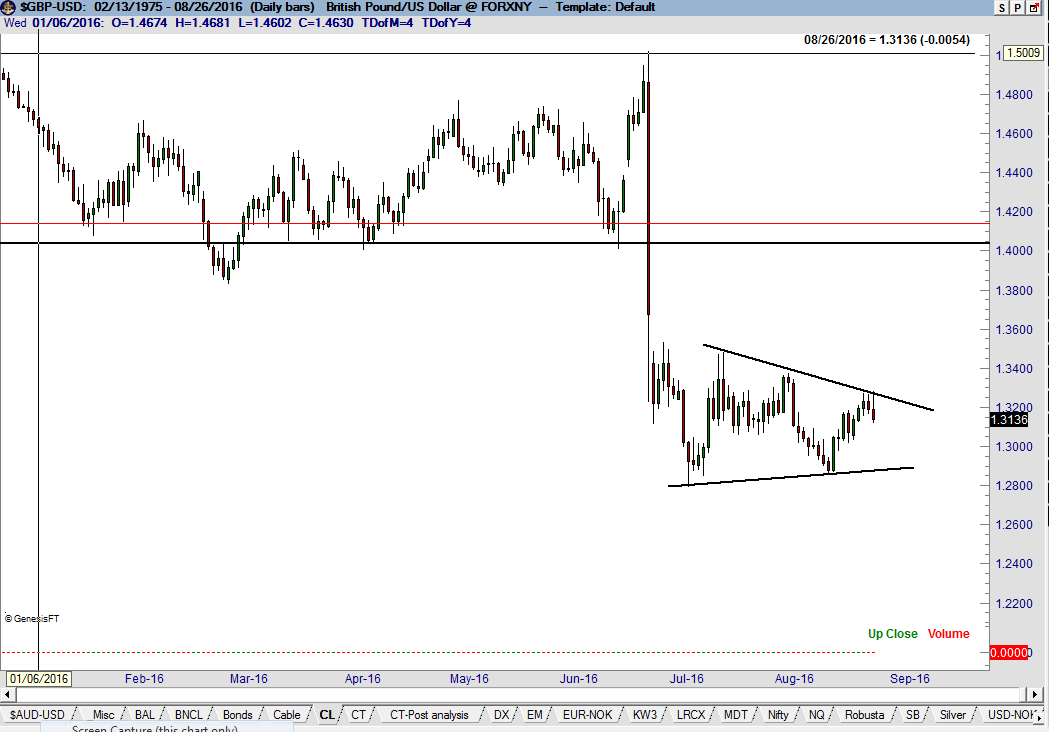
The dominant chart construction in Cable (British Pound – GBP/USD) is the completed 30- year rectangle on the quarterly graph with a target of 1.0345 — and .7790 as an outside possibility.
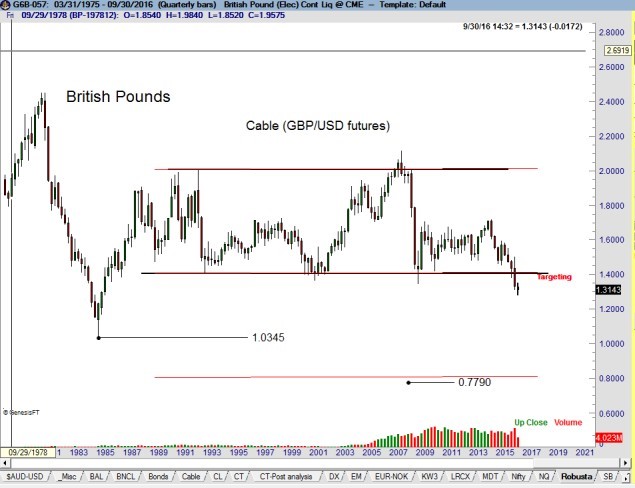
However, I will note that the Commitment of Traders data shows specs have an all-time record short position and commercials an all-time record long position in British Pound futures. This is not typically a profile consistent with a further downward trend.
I would not be surprised if GBP/USD retests major resistance in the 1.39 to 1.41 zone. Factor is flat. If the Cable does rally toward 1.40, I will be watching closely for a selling opportunity in the way of a small topping pattern on the daily chart. There is also a chance – supported by Friday’s reversal day – that the daily chart is forming a symmetrical triangle congestion.
Factor Membership is available and you could consider your membership in the Factor Service as just one more trade. If the Factor Service is not of value to you, well, it is just one more trade that did not work. Through the Factor Service I endeavor to alert novice and aspiring traders to the many pitfalls you will face – and to offer advice on overcoming those pitfalls. My goal is to shoot straight on what trading is all about. For more information watch my 30 minute webinar where we cover the Factor service in depth.
I hope you will consider joining the Factor community.
![]()

![[scribd id=86793940 key=key-24twhk1tjv9uw33hojyk mode=list]](http://peterlbrandt.com/wp-content/uploads/2012/03/Health_costs_USA_GDP.jpg)