
The Public Blog site


A frequent question from aspiring traders goes something like this: “How do I know the right time to quit my job in order to become a full-time trader?”
In 1981 I started Factor Trading Co., Inc. with less than $80,000 in trading capital. I consider myself lucky that I did not wash out – that providence dealt me a better hand than I probably deserved. But markets are a lot different today than they were in 1981. I can only offer my own opinion as to what a full-time trader needs today to go out on their own.
If you have a good career doing something else, why rush into full-time trading? Earning a supplemental income as a trader is a nice gig.
If you desire to become a full-time trader, following are what I believe to be the minimum conditions.
1. Your trading account should represent profits you have accumulated from the markets, not savings you have taken from some other endeavor.
2. Your account size should be at least three to four times greater than the amount of annual profits you are expecting to make from trading.
3. You should have at least two years of savings in the bank (other than your trading capital) to cover your living expenses. [Note: This condition is waived if your spouse earns enough to cover living expenses or if your family is independently wealthy.] Depending on trading profits to cover living expenses is a very poor place to start.
4. You should have been profitable the last two consecutive years with Calmar and Gain-to-Pain ratios of at least 1.5 to 1.
5. You should have a complete understanding of the trading plan you will begin using.
6. You should assume a 50% chance that your first year will be a losing year.
Also below is our current list of recommended reading.
Peter Brandt is a 40+ year veteran of trading. Through his Factor Service, members receive:
View your Factor Member options here. You could consider your membership in the Factor Service as just one more trade. If the Factor Service is not of value to you, well, it is just one more trade that did not work. Through the Factor Service I endeavor to alert novice and aspiring traders to the many pitfalls you will face – and to offer advice on overcoming those pitfalls. My goal is to shoot straight on what trading is all about. For more information watch my 30 minute webinar where we cover the Factor service in depth.
I hope you will consider joining the Factor community.


You can’t keep a good dog down. There are some wonderful traders I follow that have been calling for imminent collapse of the U.S. stock market index. They offer very sound, thoughtful, thorough and persuasive reasons why the U.S. stock market should not be at present levels. They have even doubled down in recent weeks on their bets. The problem is that the U.S. stock market could care less about the thinking these traders hold forth. They will likely be right … eventually. But price is always King.
Personally, I believe the U.S. stock market is in the final blow-off in the bull market that began in early 2009 – but blow-offs can be very rewarding for longs capable of catching the eventual turn in trend. The NASDAQ index is constructing a possible H&S failure pattern on the daily graph – requiring a decisive close above the right shoulder high at 4897. A H&S failure pattern would establish a profit target of 5123.
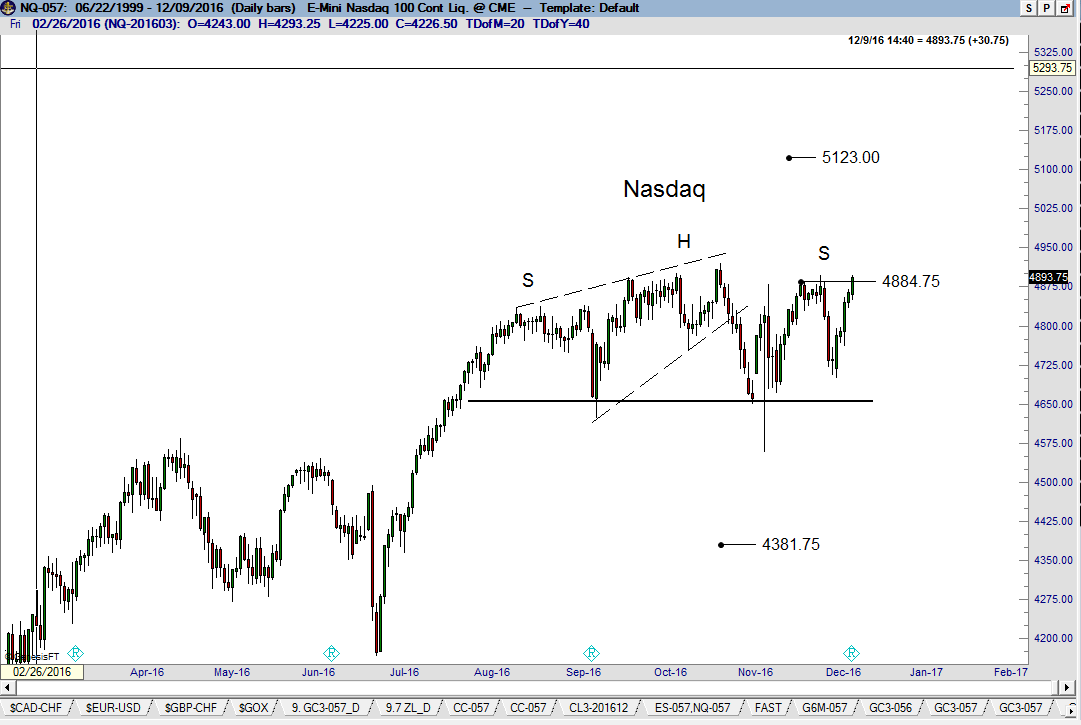
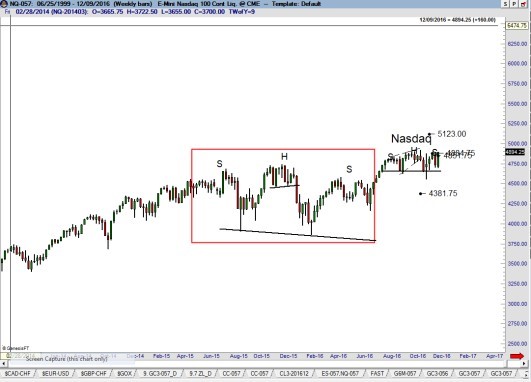
I am interested in this possible buy signal if I can find a low risk way to play it. H&S failure patterns are not unknown to the NASDAQ Index. In fact, a massive H&S failure pattern was completed on the weekly graph in Jul (see below). If I do not find a spot to buy NASDAQ with less than a 20 or so point risk I will just watch the balloons float away.
Peter Brandt is a 40+ year veteran of trading. Through his Factor Service, members receive:
View your Factor Member options here. You could consider your membership in the Factor Service as just one more trade. If the Factor Service is not of value to you, well, it is just one more trade that did not work. Through the Factor Service I endeavor to alert novice and aspiring traders to the many pitfalls you will face – and to offer advice on overcoming those pitfalls. My goal is to shoot straight on what trading is all about. For more information watch my 30 minute webinar where we cover the Factor service in depth.
I hope you will consider joining the Factor community.

 Read More
 Read More
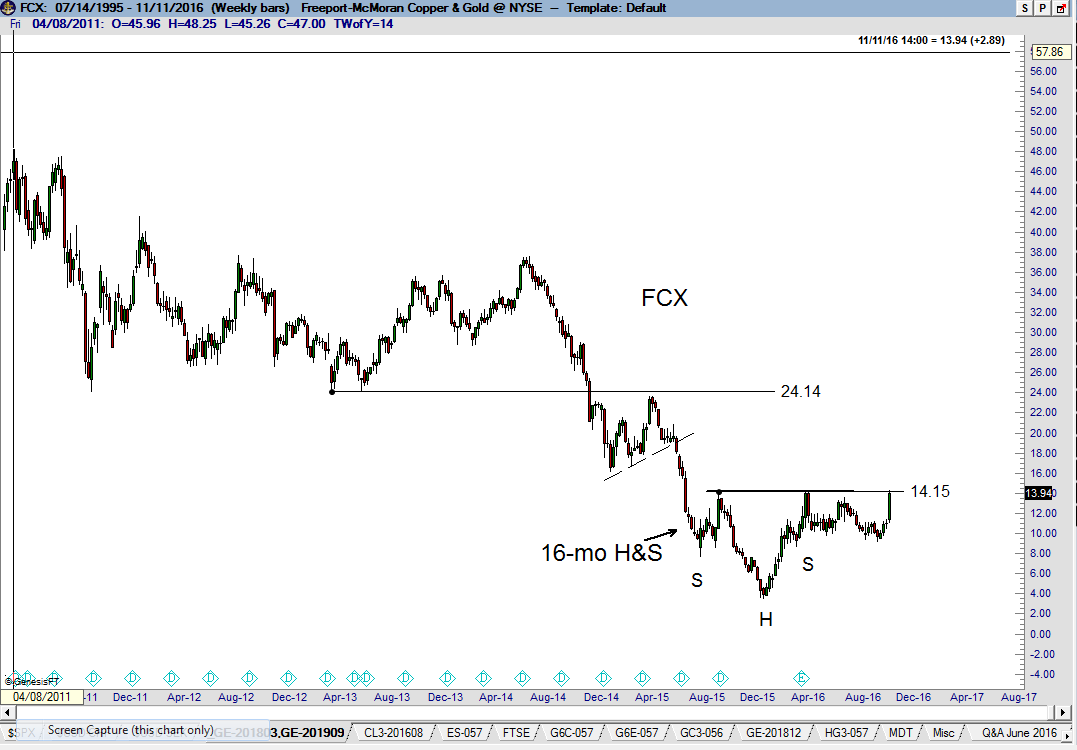
The dominant chart construction in the Freeport McMoran stock is the 16-month H&S bottom on the weekly chart. A decisive move and close above $14.70 will be my signal to buy.
Peter Brandt is a 40+ year veteran of trading. Through his Factor Service, members receive:
View your Factor Member options here. You could consider your membership in the Factor Service as just one more trade. If the Factor Service is not of value to you, well, it is just one more trade that did not work. Through the Factor Service I endeavor to alert novice and aspiring traders to the many pitfalls you will face – and to offer advice on overcoming those pitfalls. My goal is to shoot straight on what trading is all about. For more information watch my 30 minute webinar where we cover the Factor service in depth.
I hope you will consider joining the Factor community.

![]()
