Asia Breakouts
Some Asian Breakout Ideas
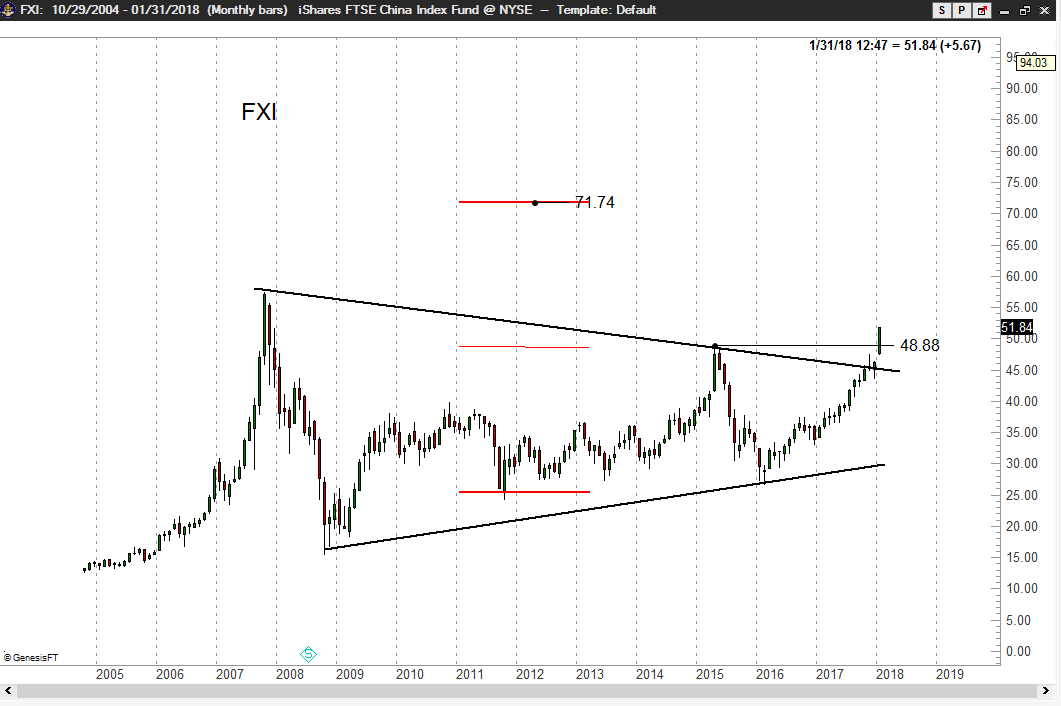
The iShares China Index Fund has completed a 10-year massive symmetrical triangle on the monthly graph. By clearing the 2015 high this ETF has an upside target of 71.74. I will buy any slight reaction in this ETF, risking to 44.77.
Singapore Index
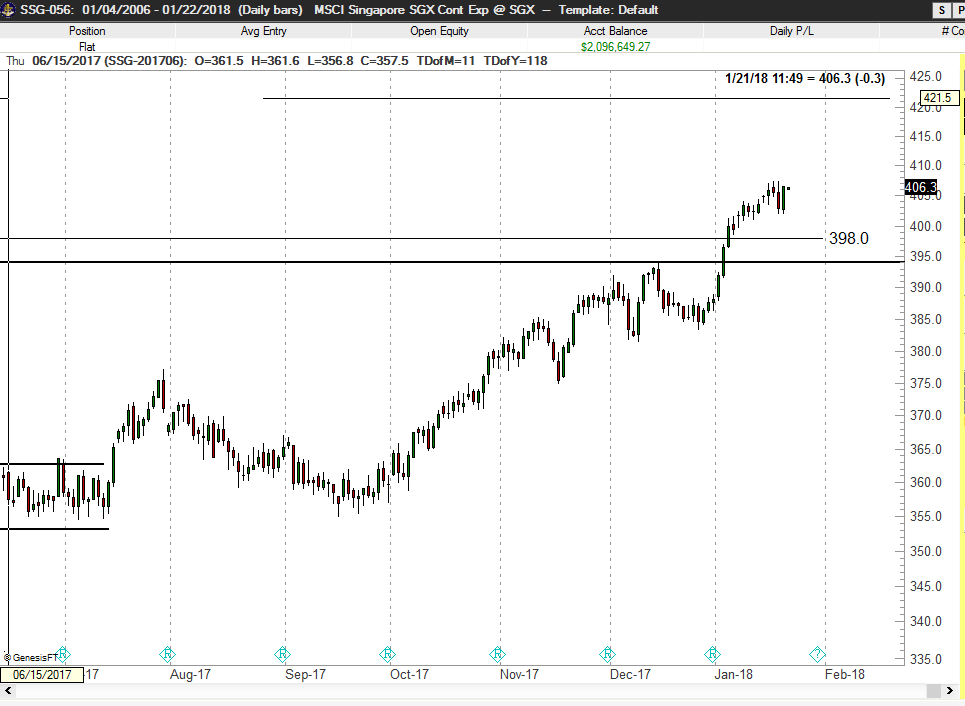
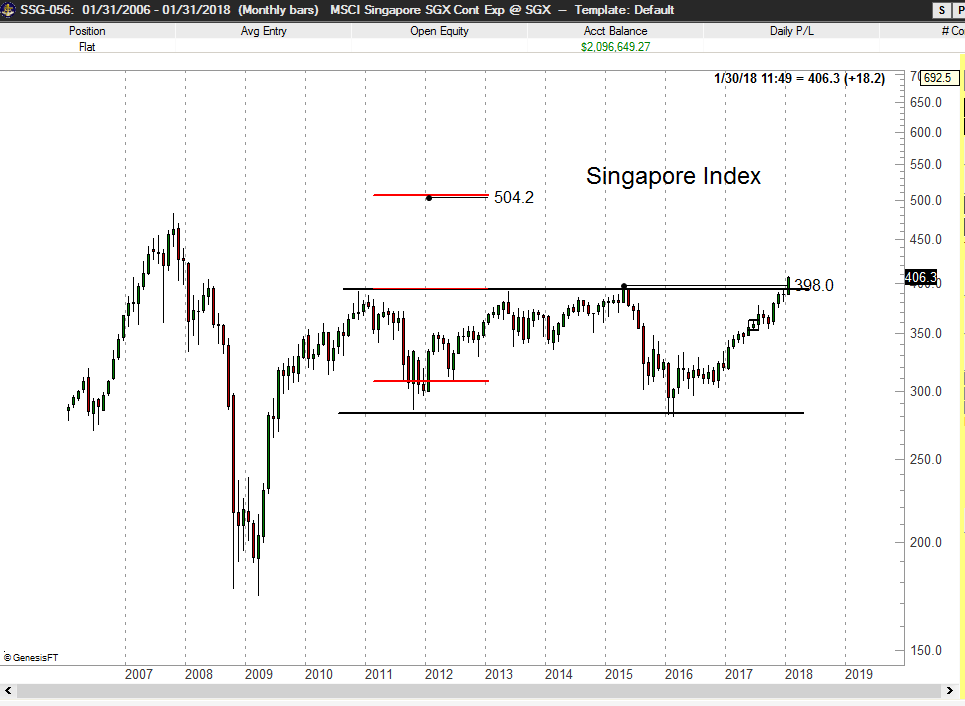
The Singapore Index (futures) has completed a multi-year rectangle on the monthly graph. I consider this to be a significant bull signal supported by fundamentals. The Shiller CASE Index suggests that Singapore is one of the most undervalued markets globally. I am willing to take a shot at the long side of this market on a retest of 398.1, risking about 75 basis points.
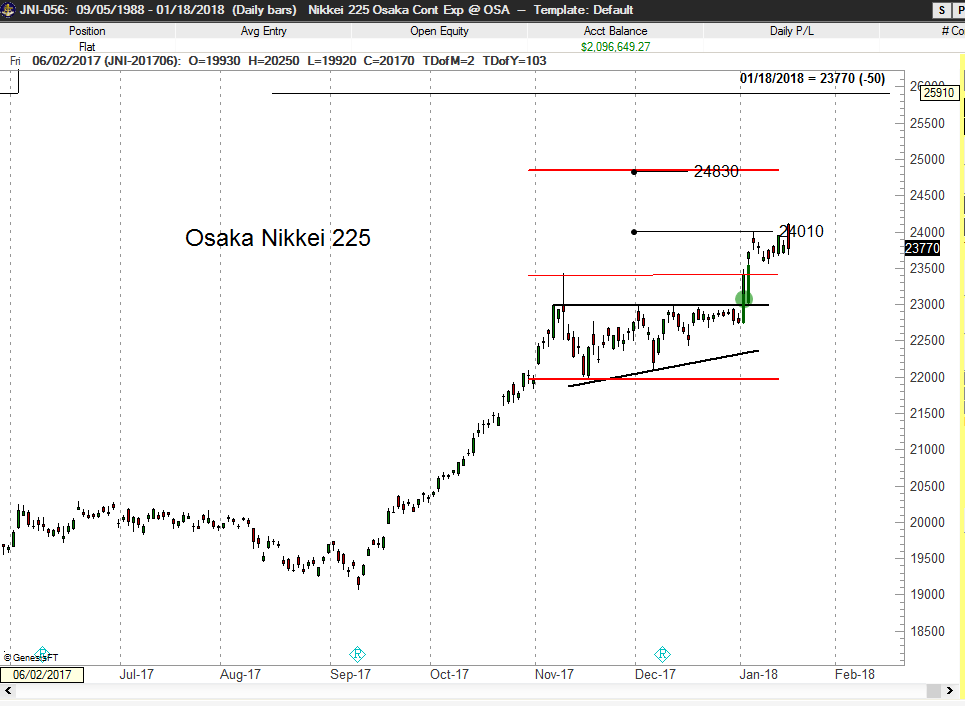
Osaka Nikkei
This one published to Factor members in the past. The target of 24,010 from the underlying 10-week ascending triangle has been met. Factor remains long a tranche with a revised target of 24,830, having taken profits on a tranche.
Factor Membership
.
Peter Brandt is a 40+ year veteran of trading. Through his Factor Service, members receive:
.
View your Factor Member options here. You could consider your membership in the Factor Service as just one more trade. If the Factor Service is not of value to you, well, it is just one more trade that did not work. Through the Factor Service I endeavor to alert novice and aspiring traders to the many pitfalls you will face – and to offer advice on overcoming those pitfalls. My goal is to shoot straight on what trading is all about. For more information watch my 30 minute webinar where we cover the Factor service in depth.
I hope you will consider joining the Factor community.


.


 Question:Peter, could you condense as briefly as possible the approach you take to trading?