Why the New Zealand Dollar is headed to $.6000
/by Peter BrandtA Soybean chart you will see nowhere else
/by Peter BrandtSome shorter-term charts that are ready to move
/by Peter BrandtA technical analysis of the old crop Soybean charts — A MUST read for all farmers and ag businesses
/by Peter BrandtAn update on Asian equities — upward explosion ahead
/by Peter BrandtA look at the Indian equities market
/by Peter BrandtHave Gold and Crude Oil bottomed — What do the long-term charts have to say?
/by Peter BrandtFactor Edition of the Best Chart Patterns in 2014
/by Peter BrandtEuropean stock index advance stronly while U.S. markets facilate
/by Peter BrandtIf you want a bull trend, look to Europe (but hedge your currency risk)
While U.S. stock market indexes display extreme volatility, European indexes are arguably in strong bull markets with room to go.
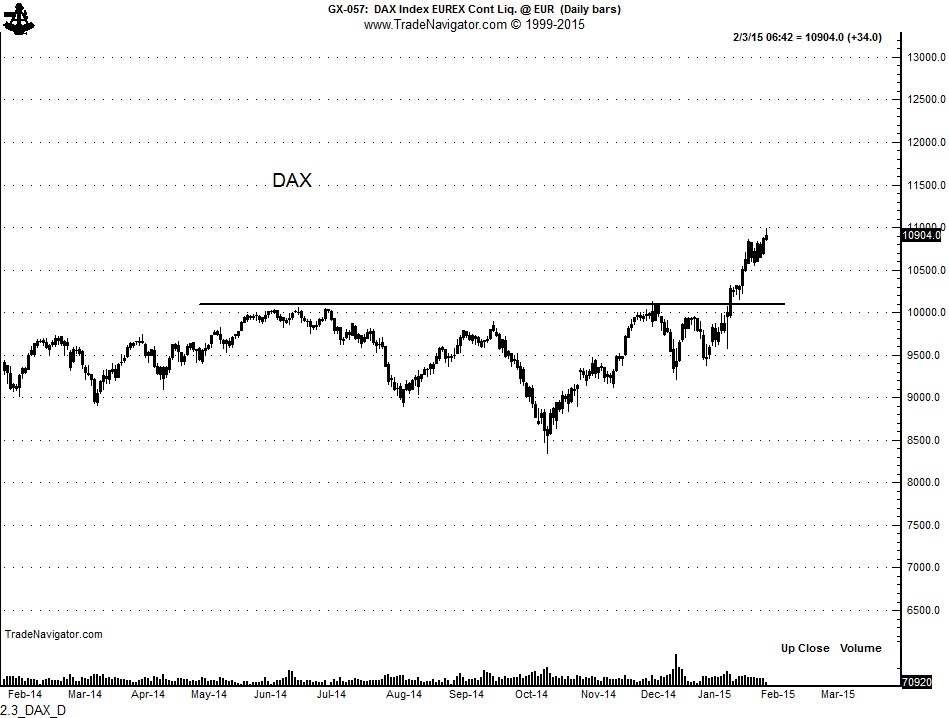
The DAX is screaming into new all-time record high ground.
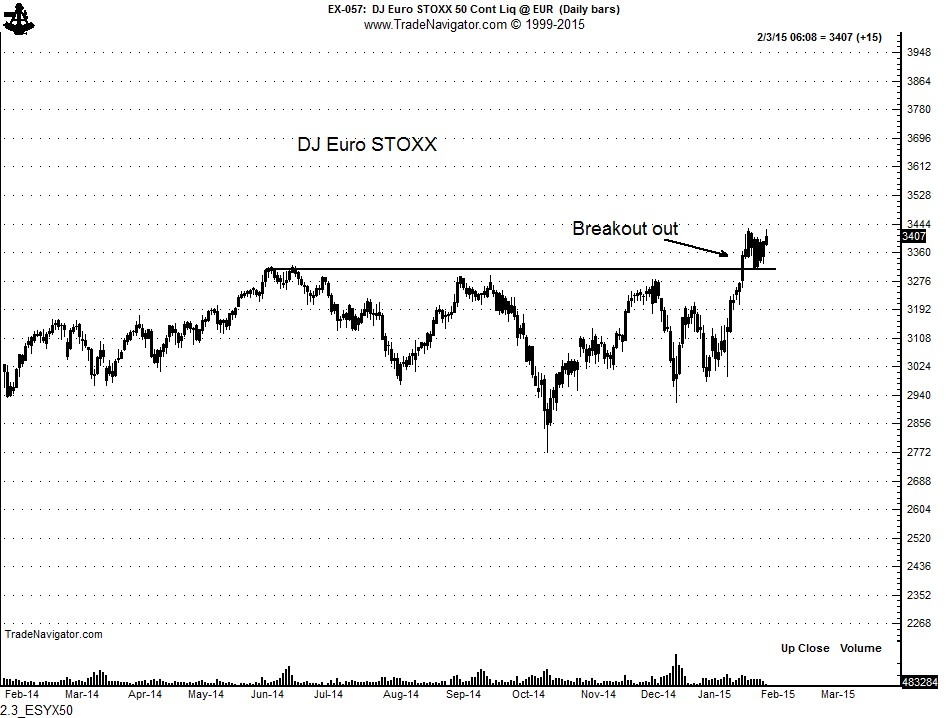
The DJ Euro STOXX 50 has also broken into new highs for the current advance, although new all-time highs are some distance away. Nevertheless, the momentum is clearly for higher prices. I am looking for a low risk entry point in futures — and that might be the resolution of the tight flag currently forming.
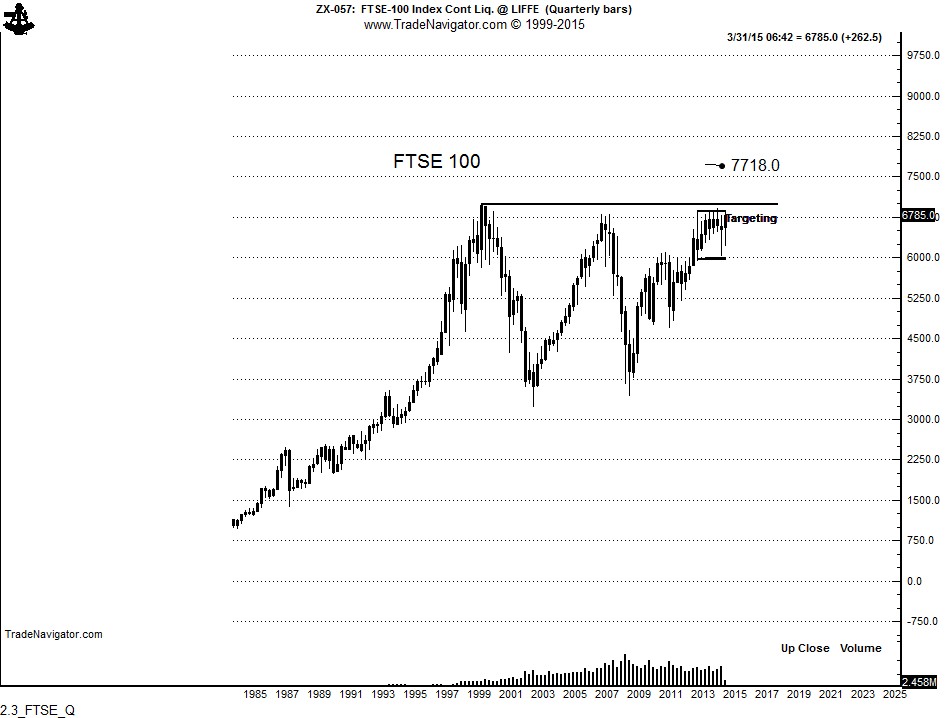
Of most interest to me as a chartist is the FTSE 100. The quarterly chart displays a 15-year consolidation zone. The FTSE has been hugging the upper boundary of this zone for the past 20 months, as shown by the weekly graph. It could be that the Index is prepared to breakout of this trading range. If so, look for a strong bull trend from the U.K.
Remember, there is currency risk in European markets. If the DAX advances by 15% but the EuroFX declines by 15% if would be a scratch trade. U.S. traders of the European futures indexes would only have currency risk on margin capital But, traders of U.S. ETFs should hedge the value of their purchases.
Markets: $DAX, $Z. $FTSE, $ESTX50
###


