AAPL Part 3, It’s All About Risk: 04.11.2011

It has nothing to do with Apple as a company!

This is my third blog posting about Apple Computer in the past week. The first post suggested strongly a possible top in AAPL. The second post detailed a three-part shorting strategy for AAPL. I executed the first two parts of that shorting strategy last week.

I have received hate email for even suggesting that Apple’s stock is subject to a sizable correction.  It has been as if I touched the third rail. People have pointed out to me that no bearish analysis should even be considered. I have heard all about the pending changes in accounting procedures for the iPhone…about low forward P/E ratios…about the sales potential in China and Asia…etc.

To my critics I would just say this: “Get a life…I mean no personal insult…I could care less if AAPL goes up or down in price.”

When I see a great signal set up on a chart, I could care less what company it is or what its fundamentals are. In fact, I could care less if I will be right or wrong in the trade — in truth, I assume I will be wrong (I am wrong about 65% of the time). The only important thing to me is the risk/reward profile of the trade.

I shorted 100 shares last week at 338, anticipating a 3-month H&S top. I shorted another 100 shares at 334.38 when a small flag was completed.  If the H&S top is completed I will short more AAPL. My protective stops are at 336.19 and 340.51. I am risking 61 basis points on the trade currently. That is 6/10th of 1%, or $600 of each $100,000. I have the potential to make 1400 basis points on the trade, that is a 14% gain on a single trade.

Successful market operations have little to do with correctly picking the direction of a stock — and everything to do with managing the relationship between risk and reward. I will take trades with a 20 to 1 risk/reward relationship any day of the week. I could care less if the trade is in AAPL, or Gold or tapioca futures.

###

AAPL Part 2 – How to build a fabulous risk/reward trade: 04.08.2011

The Apple is falling — time for the harvest?

I am a trader, not an analyst. Actually, being an analyst is a much harder job. An analyst is pressured to be right. As a trader, I assume I will be wrong 65% of the time. So my job is to find trades with a great risk and reward profile.

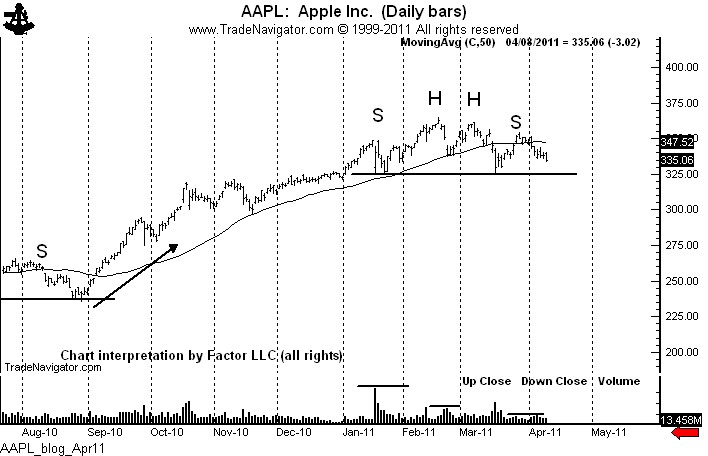
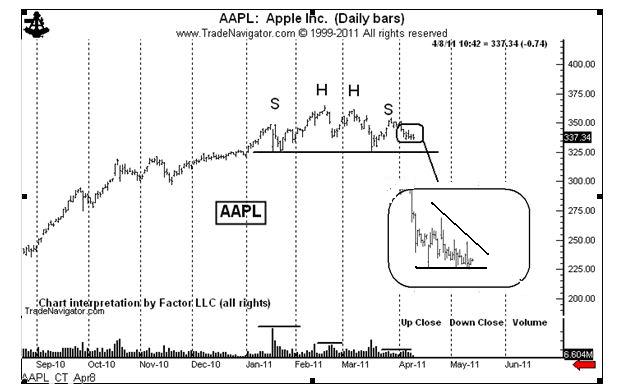
Apple Computer is a great real-time, right-now example of how I approach a trade. I believe that AAPL is building a classic H&S top. If this top works, the AAPL chart will be in the textbooks 50 years from now.

As a trader I want to limit my risk to 75 to 100 basis points per trade (e.g., no more than 1% of capital). So, I want to short Apple and risk no more than $1,000 per $100,000 of trading capital. I always think in terms of units of $100,000.

So, I go short today — 100 shares at 338. My risk is to 345, or a risk of $700 per $100,000. First layer is on.

I will short another 100 shares if the market can penetrate this week’s low and complete a small hourly chart flag. So I have an order to sell stop another 100 shares at 334.40. If I am filled I will risk my entire position to above 340 for a total risk of $750 per $100,000 on the 200 shares.

I will short another 100 shares if the H&S top is completed by a move under 322. I will then protect my entire 300 share position to just above 330. If I fill all three layers and get stopped out, I end up with a small profit.

So the bottom line is this: The most I risk by being a bear on Apple is 75 basis points. But what if I am right in my analysis and timing, and remember, a good trade has to be right on both counts? It is not good enough to be right on one component and wrong on the other.  The H&S target for Apple is 285. If the market breaks out of the H&S top and does not have a deep retest, then travels to the target, I will have a trade that yields $14,200 or so per $100,000. I am risking 75 basis points to make 1420 basis points. That’s a risk of 3/4 of 1% to make 14%. I will take a trade like this every day. In fact, right or wrong on AAPL, this is exactly the type of trade I love to find. In fact, I should stop being a chart trader if I ingore Apple.  As a trader, being right is secondary to making money. Being right is over-rated!

I think this trade has a good shot at doing what I anticipate. The reason is that nobody really thinks Apple can drop. Yet, it has declined nine out of the past 10 trading sessions, the 50 day MA has rolled over and the volume profile of the H&S pattern is absolutely textbook. It has not completed a top yet, but time will tell the story.

The AAPL is swinging in the wind from the branch. I will stand below the tree with a bushel basket.

###

The Apple (AAPL) is falling from the tree – Chart Review: 04.06.2011

Is the Apple about to take a fall from the tree?

Summary

There are chart patterns…then there are textbook chart patterns. Presently Apple Computer (AAPL) is forming a head and shoulders top that could go into the textbooks as an example of classical charting principles.

The daily chart of AAPL exhibits a near-perfect example of the H&S pattern. Several aspects of this chart are worthy of note.

  1. The pattern actually has a double head. This adds to the bearish potential of the pattern.
  2. The decline since the March 28 high (the high of the right shoulder) has taken place against the backdrop of new highs in most of the major stock indexes.
  3. The neckline is nearly flat. Horizontal necklines add reliability to a H&S pattern.
  4. The volume profile is straight out the Edwards and Mage (and Schabacker) textbooks. Note the heavy volume on the left shoulder, slightly less volume throughout the head, and finally light volume in the right shoulder, particularly during the mid- to-late March rally. This volume profile is a classic example of price distribution – shares moving from stong hands to weak hands.

It is important to understand that this pattern has NOT yet been completed. This is a chance this pattern could fail to materialize. Chart patterns are most useful as trading tools, not for making price forecasts. Short positions established at current levels could be protected using the March 28 high at 354.32. A decisive close above the existing right shoulder high would largely negate this H&S interpretation.

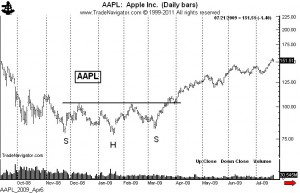
A close below 320 would complete the H&S top. Is must be remembered that the H&S pattern indicates a change in the primary trend and can carry prices far beyond the measured move. I have included a chart of the H&S bottom for Apple computer completed in 2009 prior to this incredible bull trend.

My game plan is to wait for a breakout and then risk about 150 basis points on a short position, or one and one-half percent of trading capital. The Apple may stay on the tree and ripe some more, but a strong wind could end this apple’s growing season. 

Summary


There are chart patterns…then there are textbook chart patterns. Presently Apple Computer (AAPL) is forming a head and shoulders top that could go into the textbooks as an example of classical charting principles.


The daily chart of AAPL exhibits a near-perfect example of the H&S pattern. Several aspects of this chart are worthy of note.


  1. The pattern actually has a double head. This adds to the bearish potential of the pattern.
  2. The decline since the March 28 high (the high of the right shoulder) has taken place against the backdrop of new highs in most of the major stock indexes.
  3. The neckline is nearly flat. Horizontal necklines add reliability to a H&S pattern.
  4. The volume profile is straight out the Edwards and Mage (and Schabacker) textbooks. Note the heavy volume on the left shoulder, slightly less volume throughout the head, and finally light volume in the right shoulder, particularly during the mid- to-late March rally. This volume profile is a classic example of price distribution – shares moving from stong hands to weak hands.


It is important to understand that this pattern has NOT yet been completed. This is a chance this pattern could fail to materialize. Chart patterns are most useful as trading tools, not for making price forecasts. Short positions established at current levels could be protected using the March 28 high at 354.32. A decisive close above the existing right shoulder high would largely negate this H&S interpretation.


A close below 320 would complete the H&S top. Is must be remembered that the H&S pattern indicates a change in the primary trend and can carry prices far beyond the measured move. I have included a chart of the H&S bottom for Apple computer completed in 2009 prior to this incredible bull trend.


 My game plan is to wait for a breakout and then risk about 150 basis points on a short position, or one and one-half percent of trading capital. The Apple may stay on the tree and ripe some more, but a strong wind could end this apple’s growing season.

###

Chart review 3.29.2011: $USDJPY

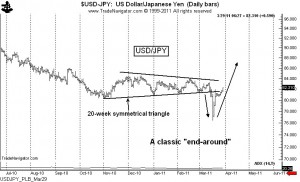
After the “wash-out” decline in mid March, the $USDJPY is performing a classic “end-around” pattern. The move back into the 20-week symmetrical triangle in early trading today (Tuesday, Mar. 29) is confirmation that the “end-around” pattern is the correct chart interpretation.

A classic "end-around" chart formation

The final confirmation of this pattern will be a close above the mid-February high. Support in the interim will be found at the lower boundary line of the original symmetrical triangle, or around 81.60. Longs can be protected at 80.49, so the risk of a long probe would be about 110 pips. The target for an “end-around” at minimum is the width of the triangle projected upwards from the upper boundary. The distance from the Nov. low at 80.24 to the Dec. high at 84.51 is 427 pips. Add 427 to the Feb. 16 high at 83.98 and the target becomes 88.25. Even from current levels of 82.27 the reward/risk profile of a long position is 3.4 to 1. Purchases at the support of 81.60 would have a reward/risk profile of 6.0 to 1.

There is obviously the chance this chart could morph into something else. But for now my best guess is the “end-around” interpretation.

$USDJPY

Special Report 3.25.11: Asian Bull Awake!

This content is for members only