EURUSD and the January Effect – An update
/by Peter BrandtCrude Oil — A case study in morphology
/by Peter Brandt2011 Best Dressed List — Best examples of classical charting principles in 2011
/by Peter BrandtA more in depth look at the stock indexes — how bullish is bullish?
/by Peter BrandtAnalog analysis points S&Ps to 1,500
/by Peter BrandtGBPUSD — Four charts show Cable to be at critical point
/by Peter BrandtJanuary Forex Effect — EURUSD headed to 1.0800
/by Peter BrandtGasoline prices are ready to ignite
/by Peter BrandtSilver H&S and flag point to 25.60
/by Peter Brandt
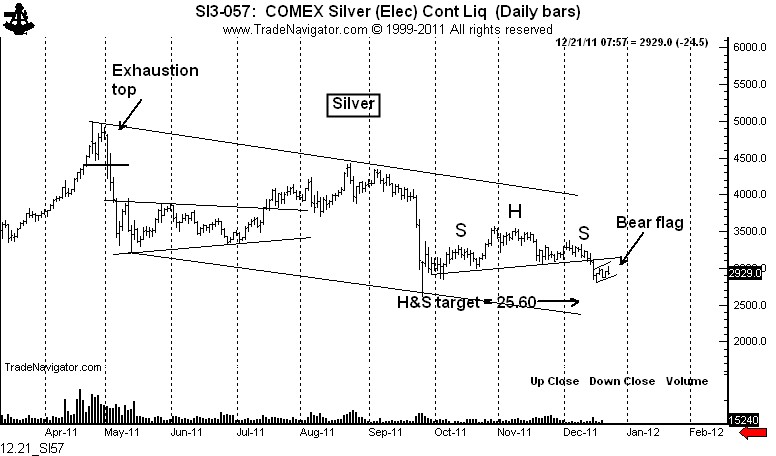
Charts produce double confirmation of a move to 25.03 to 25.60
There are four dominant technical characteristics on the Silver chart. A dominant technical characteristic is, in my way of charting, the pattern that is driving an underlying trend.
First, the market is still influenced by the blow-off top last April and May accompanied by unprecedented volume (read: “distribution of ownership”).
Second, the Silver market has an established downtrend on the daily chart. All longer-term moving averages are down. The market has formed an 8-month down channel. Anyone who purchased Silver since February 2011 has a loss.
Third, a 10-week H&S pattern was completed on December 13. This pattern has a target of 25.60.
Fourth, the market appears to be forming a brief 6+ day flag. Here is how Edward and Magee define a flag:
“A flag looks like a flag on the charts….the picture is naturally turned upside down in a down trend. It might be described as a small, compact parallelogram of price fluctuations, or tilted rectangle, which slopes back moderately against the prevailing trend.” [E&M, 5th Edition, pgs.168-173]
Flags tend to be “half-mast” configurations. If this flag serves a half-mast function, the distance from the Dec. 8 high to the Dec. 15 low should be duplicated downward from the Dec. 31 high. This would produce a target of 25.02.
Of course, this flag could be extended in height or duration or could even morph into a different probably continuation pattern. An advance above the Dec. 14 high would be the first indication of major morphing.
$SI_F, $SLV
.


