Factor Update, December 11, 2016
This content is for members only


This content is for members only
This content is for members only
This content is for members only
This content is for members only
Two comments we received quite frequently are:
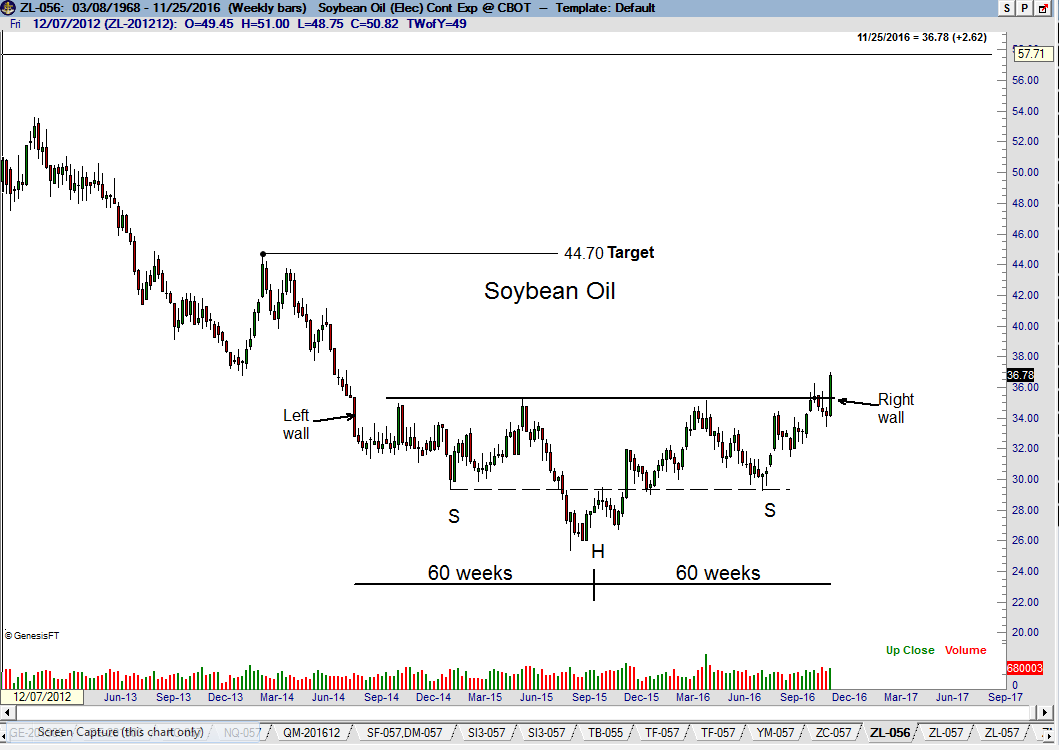
This blog post is relation to the H&S Soybean Oil pattern identified within the post from September 12th https://www.peterlbrandt.com/soybean-oil-next/
The weekly Soybean Oil continuation graph has completed one of the most perfect textbook H&S bottom patterns I have seen in 41 years following futures markets.
This content is for members only
As a trader, I have gone months and even years paying little attention to the composition of open interest as reported each week by the CFTC’s Commitment of Traders data (COT). I have covered the topic of CFTC COT Data recently, only because a number of markets have experienced all-time record levels of spec long and commercial short positions.
In a recent Factor update, I even raised the question of whether the old book on how to interpret COT data might be thrown away – that we might have entered a new and different era. Evidence now indicates that the old book and understanding of CFTC COT data still applies – that record levels of spec longs and commercial shorts is a reason for concern.
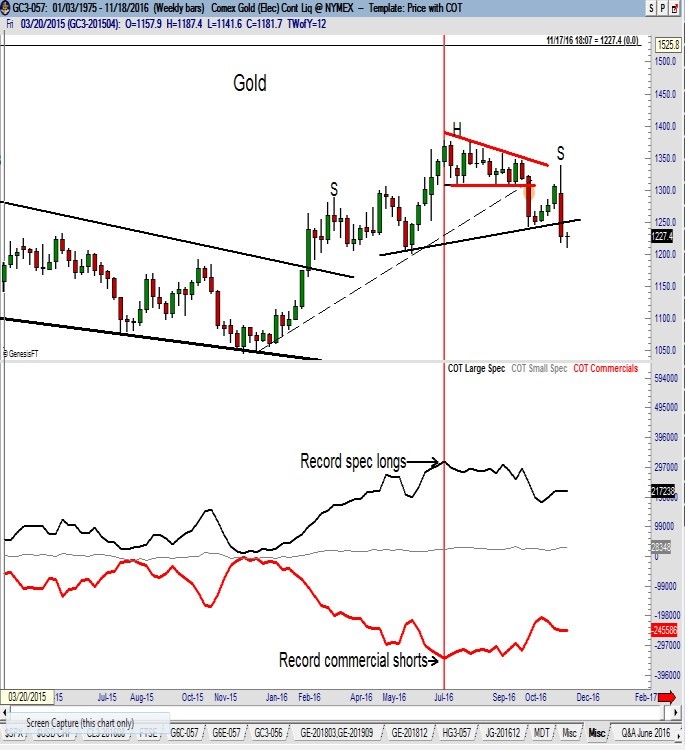
The charts below show some recent and current markets exhibiting CFTC COT extremes. In the cases of Soybean Oil, Sugar, Gold, Silver, Cotton, Copper and Crude Oil, record COT spec long positions led to significant market sell offs. It should be noted that Soybean Oil, Sugar, Cotton, Coffee and Copper are still at COT extremes, indicating that additional selling pressure is likely.
Please do not misunderstand me to be saying that record spec long positions MUST always lead to price declines. This is NOT the case. There have been times in the past when commercials have been forced to capitulate. For example, the monthly Copper chart (bottom chart featured) shows that a COT profile similar to the current profile resulted in an historic advance starting in Sep 2003.