Hodge-Podge
The last Factor Update commented on a possible bottom in Soybeans based on a H&S bottom on the continuation graph (most active contract roll).
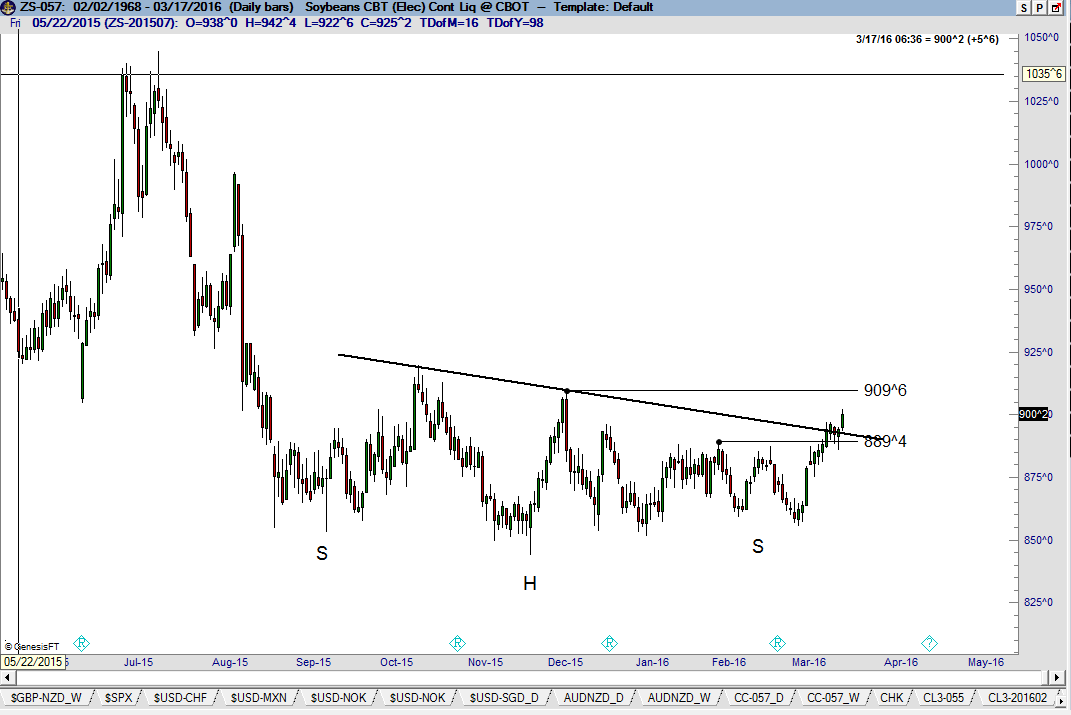
A close above 900 would, in my opinion, complete this bottom. It is unfortunate that the charts of the individual contract months do now show the precision of the continuation graph. This chart illustrates the reasons I far prefer a flat or horizontal neckline. Even though the neckline as drawn may be violates, the left and right should highs remain as serious resistance points. Thus, even though the H&S pattern might be completed with a neckline breakout, the market remains in a trading range.