Significant Factor Alert – Sep 20th
This has been a remarkable week in the markets I have been following and featuring in Factor Updates and Alerts. I have established four different positions this week -- and it is only Tuesday -- so I figure an Alert is appropriate.
Cotton -- the rally today completed the inverted 6-week H&S pattern that has served as the retest of the underlying 2-year double bottom. I initially had a stop order in place, changed it to an alert early today, then bit the bullet and bought the market almost an hour after my alert flashed. I believe the market is now poised to trend to the initial target of 78.48 with the low 90s a possibility.
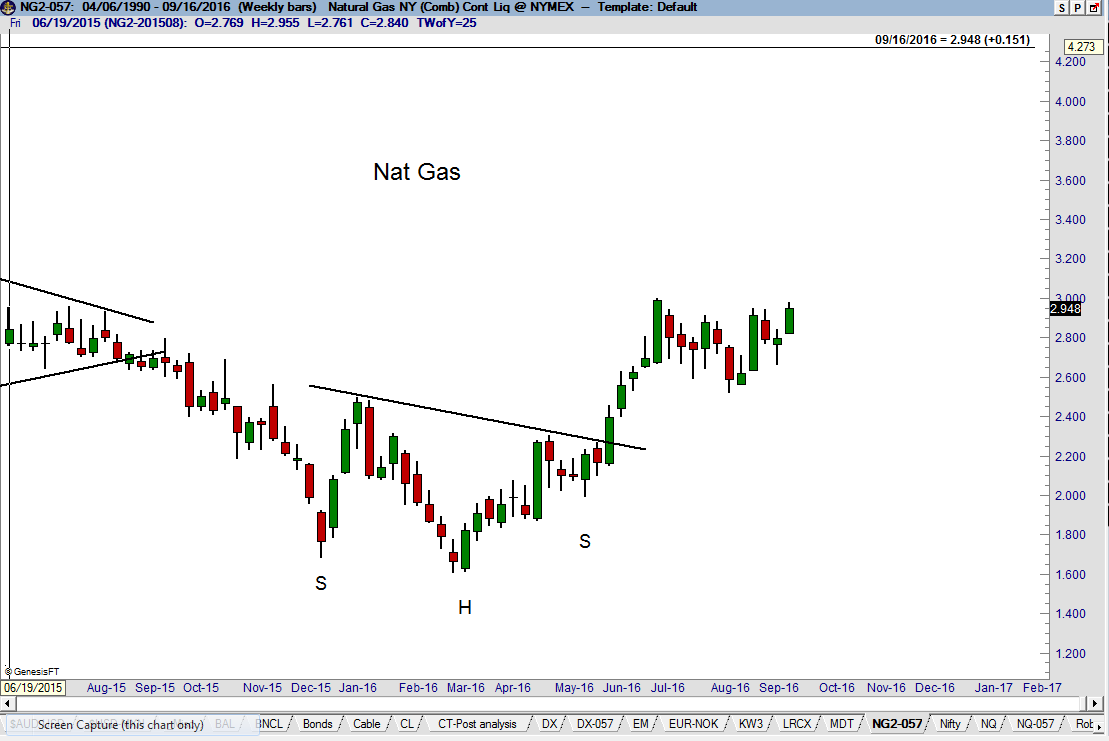
 The bottom took the form of a 7-month H&S bottom on the daily and weekly charts. The target of this H&S at 2.934 was quickly met on