July Soybeans — A Chart Lesson
The chart of July Soybeans is very instructive for traders using classical charting principles (Edwards and Magee or Schbacker).
As a starting point, no two classical chartists may label a chart in the same way. And even if some classical chartists agree as to pattern identification, it does not mean that:
- The pattern will be valid and not morph into something different, or,
- The traders will trade the pattern using the same entry and exit strategy, sizing and leverage, etc.
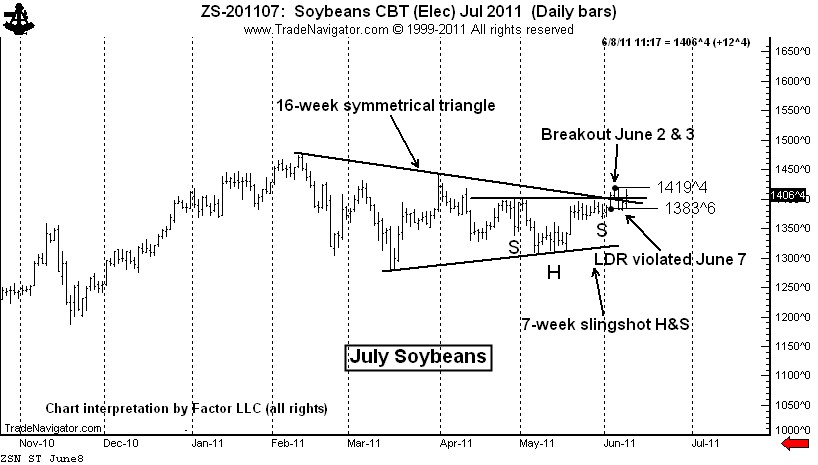
I had labeled the July Soybean chart as a 16-week symmetrical triangle. By the way, the morph rate on symmetrical triangles is quite high. Nevertheless, the pattern was mature enough that I bought the breakout on June 2 at 1402. My initial stop was based on my Last Day Rule principle (see Diary of a Professional Commodity Trader book for an explanation of this rule). The LDR price of 1383.6 was violated on June 7, stopping me out. I lost about 50 basis points on the trade.
I still have the chart labeled as the same symmetrical triangle, and view June 2nd and 3rd as a premature breakout — although the breakout could prove to be a bull trap of significant magnitude. I will receive a secondary completion signal if the market can clear the June 3 high at 1419.4 or close above the upper boundary line of the triangle (about 1404). As of this writing, July Soybeans are trading at 1402, not high enough to trigger an entry signal. If an entry signal is generated at the close, the new Last Day Rule will be the low of today at 1385.
I will go long on a secondary completion of the pattern with a risk of 50 basis points (1/2 of 1% of capital). If I go long again and get stopped out, I will no longer follow this market. I give a pattern two chances for a clean breakout.
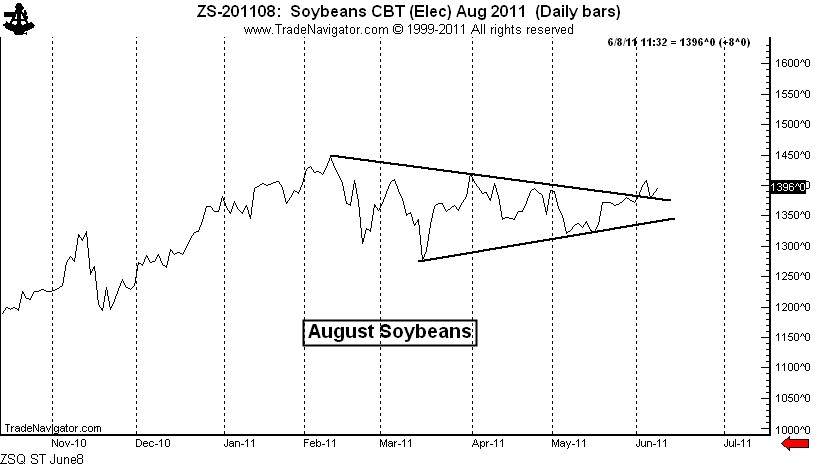
There is another lesson in this market. I have recently written about my dismay with high/low bar charts because of the noise factor. I have a strong bias in favor of closing price charts. On a closing price chart, August Soybeans completed the symmetrical triangle on June 2, but has not violated the pattern. A close below the May 31 close at 1372 would be required to violate the pattern.
Using closing price charts raises the subject of not using intraday stops, but rather using “stop-close-only” orders (real or mental). I discussed this idea in my blog posts titled “Lessons from a difficult year of trading” on May 24 and “Stops or no stops – a response to StockSage1” on May 25.
From a tactical point of view, using close-only stops (or much wider intraday stops) means that a trader must downsize his or her leverage or sizing in order to limit the risk of a trade to a certain basis point loss. Ideally, while the profit potential per winning trade would decrease with smaller sizing, the win/loss ratio would improve over an extended period of time in a manner to hopefully offset the lower leverage per trade.
Well, that’s my brain drain on this subject for now.
###


Trackbacks & Pingbacks
[…] increasingly using line-close charts, after reading this at Peter Brandt’s […]
Leave a Reply
Want to join the discussion?Feel free to contribute!