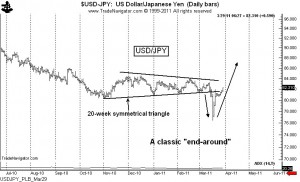
Chart review 3.29.2011: $USDJPY
After the “wash-out” decline in mid March, the $USDJPY is performing a classic “end-around” pattern. The move back into the 20-week symmetrical triangle in early trading today (Tuesday, Mar. 29) is confirmation that the “end-around” pattern is the correct chart interpretation.
The final confirmation of this pattern will be a close above the mid-February high. Support in the interim will be found at the lower boundary line of the original symmetrical triangle, or around 81.60. Longs can be protected at 80.49, so the risk of a long probe would be about 110 pips. The target for an “end-around” at minimum is the width of the triangle projected upwards from the upper boundary. The distance from the Nov. low at 80.24 to the Dec. high at 84.51 is 427 pips. Add 427 to the Feb. 16 high at 83.98 and the target becomes 88.25. Even from current levels of 82.27 the reward/risk profile of a long position is 3.4 to 1. Purchases at the support of 81.60 would have a reward/risk profile of 6.0 to 1.
There is obviously the chance this chart could morph into something else. But for now my best guess is the “end-around” interpretation.
$USDJPY


Leave a Reply
Want to join the discussion?Feel free to contribute!