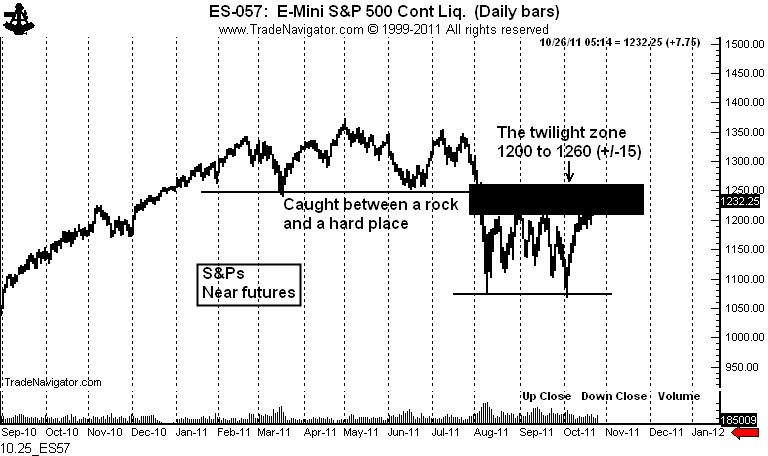
U.S. stock market — caught between a rock and a hard place
Don’t expect a follow through trend anytime soon in U.S. stocks. This market is about to get volatile in a relatively tight range. At least, that is what the chart is telling me.
The chart of the nearby S&P futures contract shows that the market is between a rock and a hard place. Above the market exists a completed H&S top. This is a powerful reversal pattern (one that I believe will ultimately prevail).
Below the market is arguably a double bottom. The other indexes do not show a similar pattern, but the nearby S&P futures chart fulfills (barely) the general Edwards and Magee criteria for the pattern. The lows are more than a month apart, but the height is only 13% of the value (the criteria is 20%). Also, the rally from the Oct. 4 low should have experienced some pick up in volume, but not as much as was characterized by the first low.
In any case, I think this market will spend some time int he 1200 to 1260 range (+/- 15 to 20 points). The pattern above should keep the market from rallying too much. The pattern below will provide support.
We will see how this market situation becomes resolved. Stay tuned, sports fans.
$SPY, $ES_F


Leave a Reply
Want to join the discussion?Feel free to contribute!