Your mean risk per trade is 3.2% — you are crazy!
/by Peter BrandtCopper: A case study of a difficult breakout
/by Peter BrandtBreakouts from patterns are not always clean and can cause tactical problems with entry and sizing. In fact, it is often the case that a trader can lose money trading a difficult breakout even if the market proves the trader right.
Copper is a great case study.
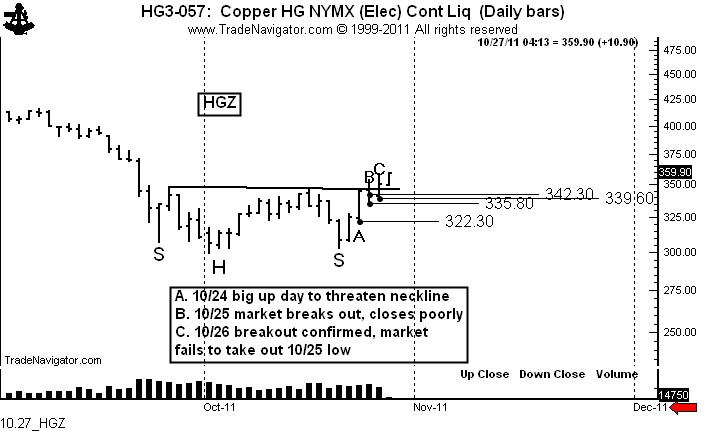
On Oct. 20 and 21 it was apparent that Copper was forming a possible H&S bottom with an extended right shoulder (meaning that the right shoulder low was futher from the head low than was the left shoulder low).
Marked “A,” the strong advance on Oct. 24 was a good indication that this pattern was a real possibility, even though the market did not penetrated the neckline. The Oct. 24 low was 322.30.
Marked “B,” on Oct. 25 the market penetrated the neckline, but closed weak. The H&S bottom was not completed on a closing basis. However, increasingly breakout days that close back within a pattern can be used as the basis for a protective stop. A purchase at unchanged or lower on Oct. 26 could have used the Oct. 25 low as a stop-out point.
A characteristic of a valid upside breakout is that a series of higher highs occur even if the breakout is sloppy.
Marked “C,” the market finally confirmed the H&S bottom with the close on Oct. 26. However, buying the close on this date at about 351 would carry a risk to below the same day’s low at 339.60.
Let me move this case now to address position sizing. I am a believer that risk should be limited to no more than 100 basis points, or 1% of the total size of a trading account (or composite of accounts). This means that a long taken on the confirming close on Oct. 26 had a risk of approximately $3,000 per contract.
Under my risk rules, and using a stop that makes technical sense and is not just an arbitrary dollar amount, $300,000 would be the minimum sized account that could have bought Copper on Oct. 26.
Copper has an upside target of around 396.
$HG_F
###
U.S. stock market — caught between a rock and a hard place
/by Peter BrandtDon’t expect a follow through trend anytime soon in U.S. stocks. This market is about to get volatile in a relatively tight range. At least, that is what the chart is telling me.
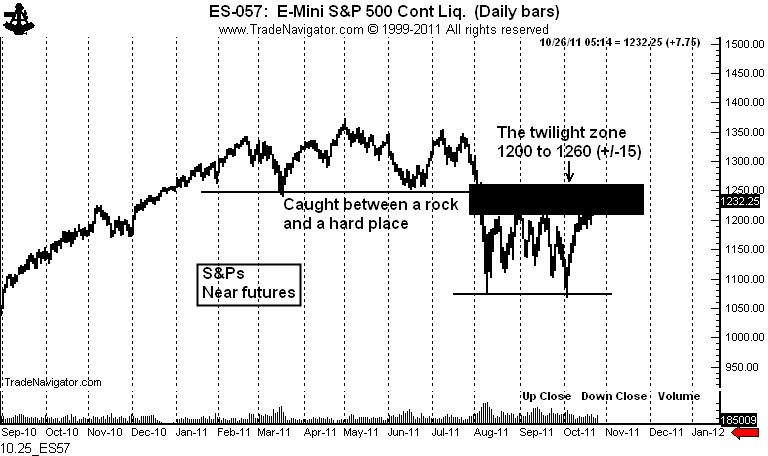
The chart of the nearby S&P futures contract shows that the market is between a rock and a hard place. Above the market exists a completed H&S top. This is a powerful reversal pattern (one that I believe will ultimately prevail).
Below the market is arguably a double bottom. The other indexes do not show a similar pattern, but the nearby S&P futures chart fulfills (barely) the general Edwards and Magee criteria for the pattern. The lows are more than a month apart, but the height is only 13% of the value (the criteria is 20%). Also, the rally from the Oct. 4 low should have experienced some pick up in volume, but not as much as was characterized by the first low.
In any case, I think this market will spend some time int he 1200 to 1260 range (+/- 15 to 20 points). The pattern above should keep the market from rallying too much. The pattern below will provide support.
We will see how this market situation becomes resolved. Stay tuned, sports fans.
$SPY, $ES_F
What is the %win vs. %loss ratio of your present trading scheme?
/by Peter BrandtI am gathering data sets for posts I will eventually write on risk management based on probability theory. You will all be shocked with the results of the modeling. I will post the results of the modeling, but not the construct of the model.
I need your cooperation. There will be one more poll after this one. Please forward the link to anyone you think can contribute to the polling results.
[poll id=”5″]
The difference between a market opinion and trading
/by Peter BrandtNew poll: As a percent of trading capital, what is your average risk per trading event?
/by Peter BrandtPlease answer this poll. Be honest — I have no way of knowing who participated or who answered what.
I plan to convert the results into a data set, that when combined with the data from a couple of future polls, will allow me to do some posts on risk management and probability theory.
[poll id=”4″]


