Silver – What’s next short term?

Most chart patterns fail and then morph into larger patterns in a process I call “redefinition.” This is especially true of intraday charts. They are extremely unreliable.

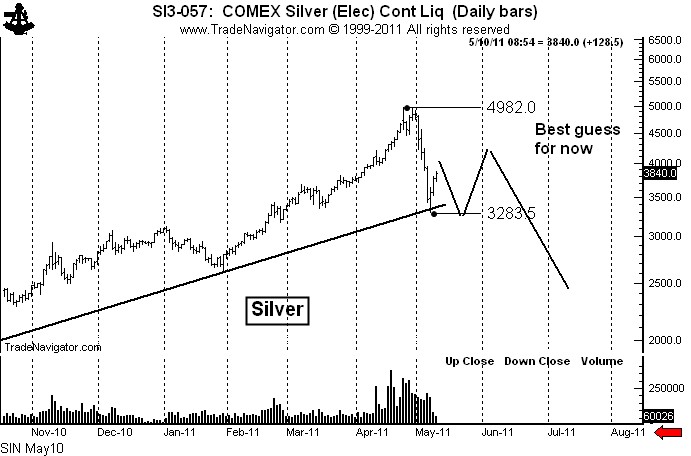
With this in mind, here is my best guess on the short-term chart structure of Silver.

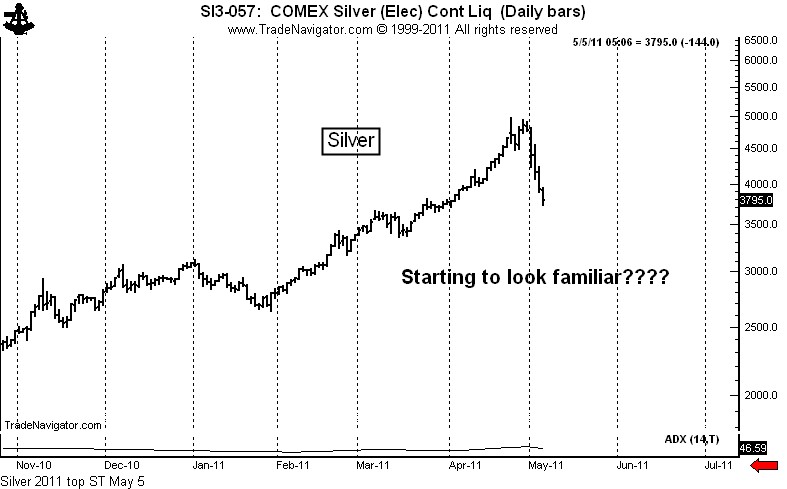
On the daily chart, a major top is in place. I keep hearing people talk about waiting for a decent break to buy  — about catching the next upleg in the market. Unbelievably, many “investors” are still bullish on Silver. To me this is a gigantic red flag. Conventional wisdom (i.e., the prevailing view of the marketplace) holds that Silver is in a significant correction within a much larger bull trend. The bias of investors (those not wiped out by the first decline) is to be long.

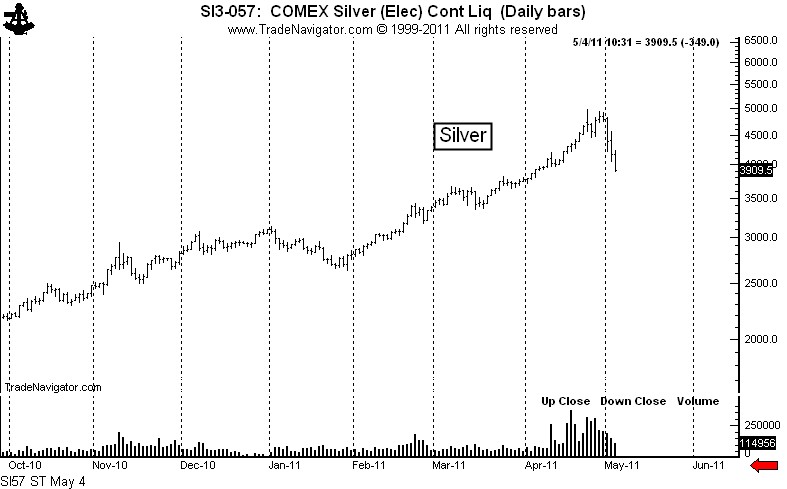
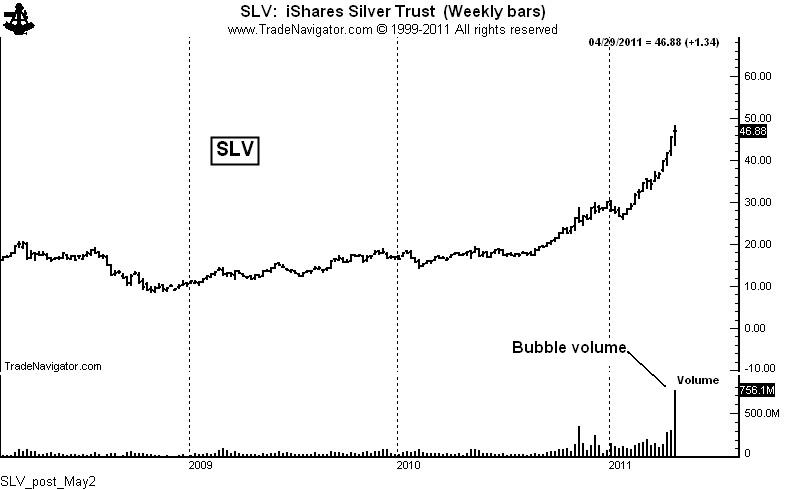
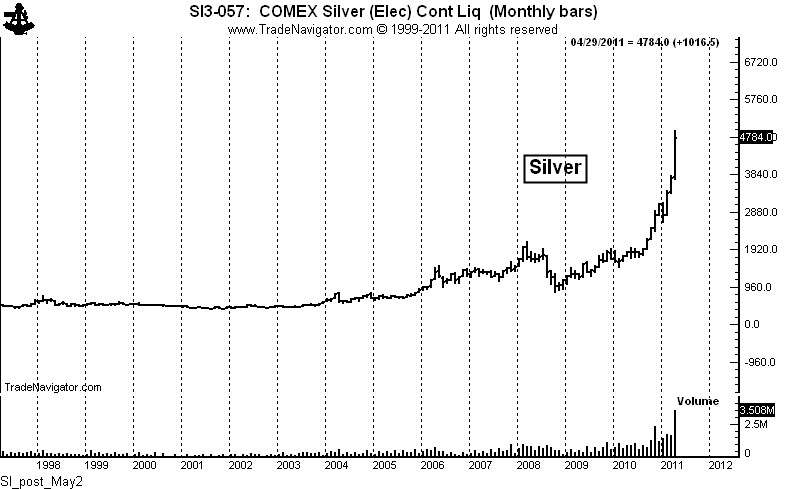
What we know for certain is that a parabolic move ended in massive record volume in Silver trading (futures and ETFs). This is a sign of a top. The burden of proof is on the bulls. In fact, should the market rally and make a new high it would be one of history’s great shorting opportunities. People have attempted to convince me that Silver was not in a parabolic move. WHATEVER!!!!!

Make no doubt about it, Silver has topped. If it has not topped, it will be many, many months before a legitimate bull trend can re-emerge.

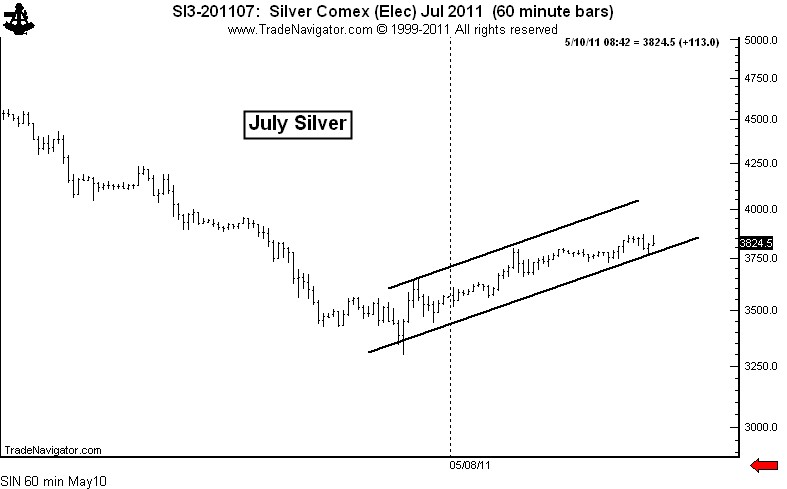
Short term, the hourly chart displays an advancing channel. I believe that a bear market correction to the $39 to $44 zone is possible, but not on this leg up.

More than likely the market will have a further downward correction, perhaps even making a new low for the decline, before a more serious rally into the low 40’s can occur. From a market psychology standpoint, a decline to the low 30’s followed by a rally into the low 40’s would get the bulls all excited again — just in time to be slammed once more.

Then the market should drop into the mid 20’s.

Full disclosure: I have no position. I have no bias to defend. I don’t really care where Silver goes. I am perfectly ok if Silver goes to 5 or to 100. I don’t care if my next trade is short or long. I only care that sometime in the next 12 months the Silver market will give two or three low risk/high reward chart setups.

###

Silver — history repeating itself

Three reasons why Silver might be close to a temporary bottom (within a larger bear market).

  1. There will be support at the trendline from August and January lows. Today could end up as a reversal day.
  2. Small investor may be washed out — this is needed for a rally to occur. SLV had record volume Thursday at 294 million shares. More volume than SPY. This volume represented small investors liquidating, not accumulating. The buyers were people who took profits last week. Sorry, small investors, this is the way the raw material markets work.
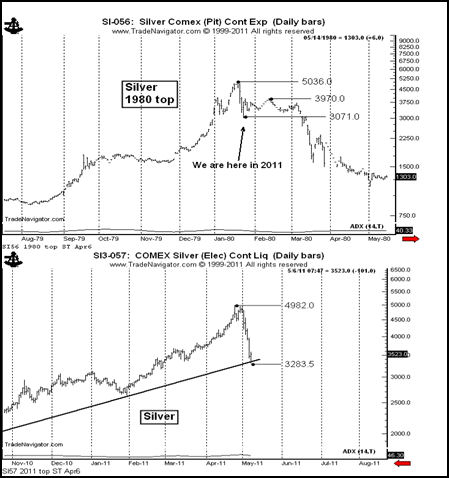
  3. The top in 1980 would indicate a rally from here. The rally should not exceed $39 to $42. Do not be confused — Silver is now in a bear market.

Soybean Meal — building a 2011 top

This content is for members only

“Cops raid the brothel” — part 2

I left out an important part of history in yesterday’s post on Silver…that is, the origination of the phrase: “When the cops raid the brothel, everyone is arrested, including the piano player.”

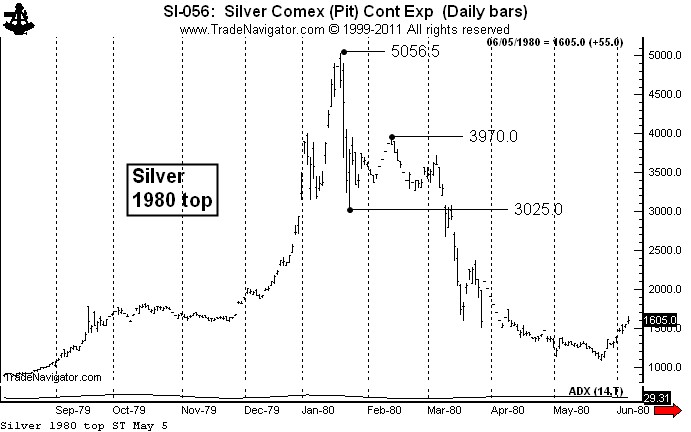
I first heard this phrase at the CBOT in early 1980 in direct reference to the Silver market collapse. On the chart below you will note that Silver topped at 5056, dropped quickly to 3025, recovered to 3970, then was destroyed to 1080 and eventually 4 (that is $4 per oz.) for a total decline exceeding 90 percent.

The reported reason for the decline was the failed attempt to corner the physical market by the Hunt brothers of Texas. Today’s equivilant would be a combination of JP Morgan and the small speculators through the ETFs. The CFTC stepped in January 1980 and hiked the margin requirements. The rest was history.

The real reason for the decline was that Silver had no business being at $50, that Silver is a COMMODITY, and that commodities have boom and bust cycles.

Many, many investors got wiped out by the drop. During a meeting at the CBOT, a member made the statement, “Isn’t it too bad that not only the Hunts got wiped out, but little investors who had nothing to do with the manipulation also lost the family farm.”

To this comment, and old-time trader made the statement…”Well, you must remember, when the cops raid the brothel, everyone gets arrested, even the piano player.” I will never forget the phrase or the meaning of the phrase.

By the way, the conventional wisdom during the advance of 1979 (extending far into the 1980s) was not much different than it is today. Inflation concerns, worries about fiat currencies, fed policy, etc. These were the reasons the small investor bought Silver then and the reason they bought Silver in this cycle. Margin call after margin call later, the small investor always plays the role of the piano player.

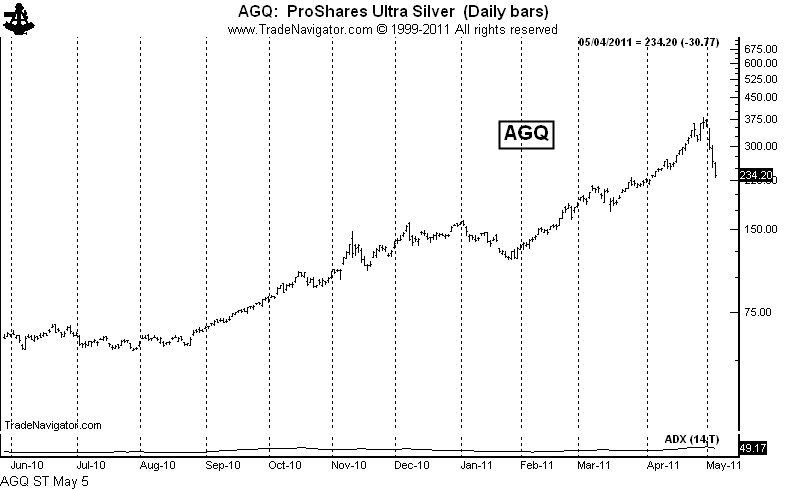
By the way, a good way to play Silver in stocks is to short the ultra long, AGQ. Of course, pick your spots and use stops. Even if Silver develops into a broad trading range, AGQ will decline.

###

When the cops raid the brothel, everyone is arrested, including the piano player

Silver prices cannot go down, after all, the US$ remains weak! The fed is out of control…inflation is brewing…my macro model calls for further gains…China is still buying…my canary is sick…my mother-in-law bought a new Honda, etc., etc., etc.

This is all I heard as a result of my posts on Silver in the past week. Now, I want to be cautious not to crow, because those who crow end up eating crow down the road.

But the reality is this — Silver is a commodity. As a commodity, Silver is subject to boom and bust cycles, just like Sugar, just like Soybeans, just like Coffee. There is nothing special about Silver. Do you believe me yet?

Let’s put this decline in Silver into perspective. An $11 break in Silver is worth $55,000 per Comex contract. This is equal to a $550 move in the price of Comex Gold, an $11 move in Soybean prices, a $2.20 move in the price of Copper, a $1.46 move in Coffee prices…should I go on?

The Silver market presently is about one thing and one thing only…margin call liquidation. Silver prices have nothing to do with everything people told me would drive prices higher. Silver prices are about thousands of small speculators long above $45 per ounce.

The commodity market behaves like a living, breathing entity. The market instinctively knows when a group of investors are in trouble. And when a group of investors are in trouble, it is like a brothel raided by cops. Everyone gets arrested.

This phase of liquidation will not last forever. But it will last until every small speculator long above $45 per ounce is forced to liquidate. Every last one. Only then will Silver be able to experience a sharp counter-trend bounce. But make no doubt about it, the bounce will be counter-trend. When the bounce occurs an entirely new group of investors will jump aboard thinking the bull market is once again alive and well. These investors, too, will end up in a brothel raid.

###

So you want to be a money manager?

There are a lot of you out there on StockTwits.

I get more questions via email from traders like you about the managed futures/forex world than about any other subject. It seems that a lot of you aspire to manage money in stocks, futures or forex.

While I mostly have been a proprietary trader through the years, I do know a lot about the managed futures and forex space within the alternative investment category. A number of the other StockTwit bloggers know the ins and outs about managed funds from the stock market perspective (knowledge I do not possess), such as my friends Joshua Brown at TheReformedBroker and Derek Hernquist, Howard LindzonDragonflycap, Quinttatro, johnsontrades, valueplays, and joefahmy.

I was a trader in the 1980s and early 1990s with Commodities Corp. (CC), the original multi-trader futures and forex prop house. My performance during those years for CC was acceptable, but not great – 18.52% AROR, no losing years, worst drawdown of about 10%. Frankly, I was a boy among men at Commodities Corp. CC launched the trading careers of the superstars – the guys you read about in Market Wizards. I do not place myself in their league.

Consider this post to be the first of many on the subject of managed futures and forex, what the industry is like and what steps you would need to take to qualify as a player. I think that you will be very surprised with some of the information I will share.

Presently about $290 billion is being managed in futures and forex. This is money dedicated to Commodity Trading Advisors (CTAs), as reported by Barclay Hedge. Other areas of the alternative investment category also have commodity and forex exposure.

I believe that within five years the managed futures space will grow to $1 trillion or more. It is the fastest growing subset of the hedge fund world. The opportunities in the next five to ten years are great for emerging traders that have the right stuff.

The ten largest CTAs manage $82.4 billion, or more than a quarter of all assets under management (AUM). You would think that these CTAs are superstars. Not so!

Ten largest CTAs by Assets Under ManagementThrough March 2011
Category Average Range
Assets Under Mgmt $8.2 bil $1.8 bil to $23.6 bil
5-yr AROR 7.86% -3.23% to 19.27%
5-yr worst drawdown (11.09%) (8.49%) to (29.43%)
5-yr. Calmar ratio .71 -.11 to 1.53
Duration of longest DD – peak to valley to new peak  23 mos  9 mos to 46 mos


I want to note two things.

First, the performance of the largest CTAs is pathetic, in my opinion, although with a losing year going in 2011, I am a bit shy to be too critical. These CTAs receive huge asset infusions because institutional money flows to the big boys, despite their poor performance. CTAs with a long history, big staffs and huge AUM levels receive the assets allocated by pension funds, huge Commodity Pool Operators (CPOs), etc. The $100 million AUM level is the minimum for a CTA to be considered for institutional funding. The CTA with the most AUM ($23.6 Billion, that’s with a “B”) has a five-year AROR of 4.74%.

Secondly, I believe that the Calmar Ratio  is the best measure of risk-adjusted performance (although the Sortino Ratio is not bad either). To determine your own Calmar, divide your compounded average annual rate of return by your worst month-ending peak to valley drawdown.

The managed futures industry is obsessed with the Sharpe Ratio, which I think is a useless measure, mainly relied upon by institutional money placers to justify poor performance. At industry conferences, such as the Altegris event in San Diego two weeks ago, investors and pool operators drooled during a presentation of the Sharpe Ratio. Yet, the Sharpe Ratio penalizes upside performance. A trader who holds his or her money together with solid risk management for 10 months, then has two wonderful months to make a year, would be murdered by the Sharpe Ratio.

Third, are you surprised by the duration of the longest peak-to-valley-to-new peak drawdowns? Would you have guessed these drawdowns would have been so long? The truth be told, even CTAs in which I have great respect experience long drawdowns.

In the next post I will focus on the performance stats of the CTAs I have selected for my own IRA funds. I want my IRA money in managed futures, traded by people other than myself. 

###

Turning a chart on its head

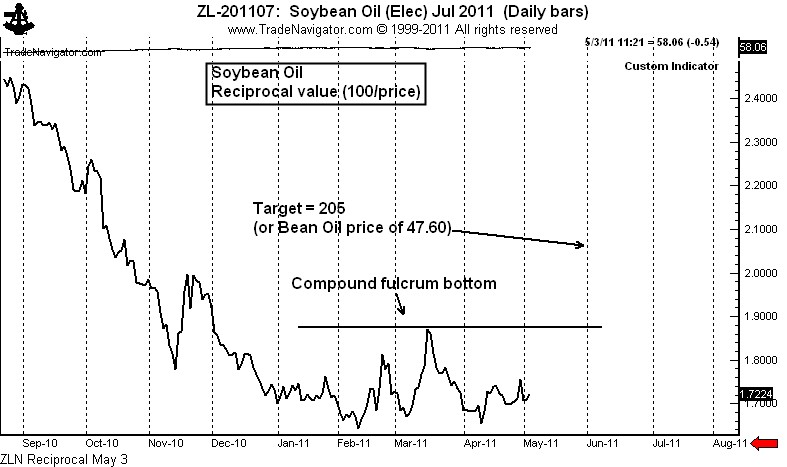
Sometimes a possible top gains clarity if one can flip the chart over and view it as a possible bottom. The easiest way to do this is to print a chart and flip it 180 degrees. But since I cannot do this with a blog post, I did the next best thing — convert a chart into its reciprocal value. Those of you familiar with spot forex know exactly what this means and how to do it. Forex trades can trade many currency pairs in the reciprocal.

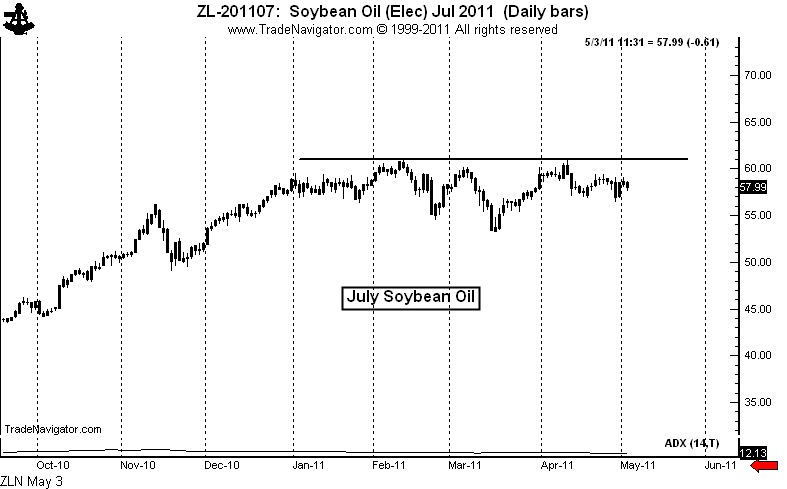
The possible top I am referring to is in Soybean Oil. First, let us look at the chart straight away.

My initial response to this chart is that a contiuation congestion is occurring and that a breakout into new highs would lead to another strong advance.

But when I “flip” the chart, my initial reaction is different. Shown below is the reciprocal value chart of July Soybean Oil. What can be seen very clearly is a possible bottom pattern known to point and figure chartists as the “compound fulcrum.” The compound fulcrum is a bottom pattern about 80% of the time, a top pattern the other 20%, and is a powerful chart formation.

A compound fulcrum bottom can best be described as a H&S top pattern that serves as a bottom. Keep in mind that a bottom in the reciprocal chart equals a top in the actual commodity.

This pattern in the July Soybean Oil would have a target of 205 which is equivalent to 47.60 in the price of July Bean Oil (compared to a current price of 58.00). There are two problems with this trade. First, more price action is needed to develop symmetry in the pattern — another two to three weeks of sideways movement followed up a gradual uptrend in the reciprocal chart would do the trick.

The second problem is fundamental in nature. Soybeans are VERY cheap compared to Corn, and Soybean Oil is likely to remain strong compared to Meal, because Meal is now competing in the feed market with the residual mash from the Corn ethanol process. While these factors do not seemingly bode well for a bear trend in Bean Oil, conventional wisdom is often wrong. Some of my best trades over the years have been trades flying in the face of conventional wisdom. The public is a major long in grains. The public is subject to shake outs.

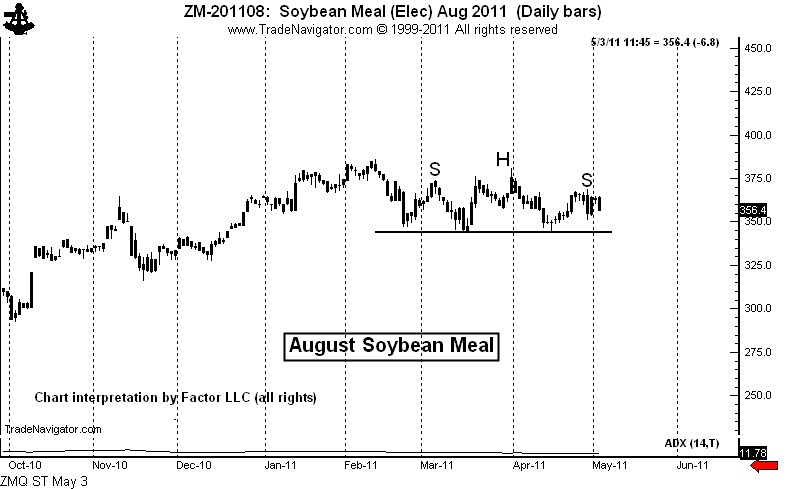
The Soybean Meal chart is also potentially bearish. The August contract daily chart displays a possible top in place followed by a H&S pattern.

If these patterns develop more fully they would set up as trades for me. Remember, I am looking for patterns that will stand the test of historical scrutiny as among the best 10 to 20 classical patterns of the year. I think both of these charts are candidates. But the price action has not yet confirmed the signals.

###

Silver bulls, don’t worry, just draw a lower trendline

This content is for members only

Blogging vs. trading!

 What do the two have in common?

An opinion is NOT a position. A position is NOT an opinion. In the final analysis, the two have nothing in common. Yet, be aware that in this blog I sometimes present opinions and market perspectives (and misc. things I find interesting at the moment) and other times venture into the world of positions.

I have supported myself and my family by trading commodity futures and forex since 1980. Along the way I have made every mistake possible – many more than once. I have had really great years, and I have had losing years. I have had spectacular trades, and I have regularly had drawdowns (in fact, I am in a drawdown right now, so ignore any specific trading idea I might present).

Over the years I have formed principles that guide my trading. One of those principles is that an opinion is not a trade. I may have an opinion – even a strong one – about a particular market, but that does not mean I will have a position. Similarly, whenever I have a position I try not to form an opinion, because opinions lead to biases, and biases can lead to bad trading decisions. Frankly, I think that market opinions are dangerous when they are mixed with trading strategy. All too often I mix this fatal brew.

So, if market opinions do not guide my trading, what does? The charts…and specifically, classical chart patterns that are usually eight or more weeks in duration (preferably 14 weeks or longer) and offer specific risk control set-ups for entry. Because I always risk much less than my profit target, my ratio of losers to winners is quite high and always has been. Historically I am unprofitable on 65% of trading events, although over short periods of time that figure can range from 50% to 80%. Personally, I think the idea of chasing trading approaches that are right 80% of the time is a joke. I believe that the payoff in trading comes from risk control protocols, not from trade selection.

I have made my net-bottom line profit from fewer than 10 percent of my trades. The other 90 percent of trades have been wash-outs. Wouldn’t it be wonderful if I knew in advance which 10 percent of the trades would deliver the goods? Although even if I did know this in advance, my human emotions would probably push me into some of the other trades.

Some of my blogs have expressed opinions or perspectives on markets in which I have not had a position. I have no position in Silver nor is there any chance I will have a position within the next two or three months. I am long Gold and have been since April 5. The market came within an eyelash of my target on Monday, so I will now jam my stop.

A lot of my blog posts (perhaps the majority) reflect opinions or market commentaries or market perspectives that are disconnected from my trading operations. If you only heard from me when I took a position, you would not hear from me very often (perhaps you would rather have it this way). Similarly, I post a number of charts on Chart.ly that I find interesting, but do not even come close to qualifying for an actual trade.

But, periodically I will tout a trade I am entering – and again, a position is not an opinion and an opinion is not a position. A position, purely and simply, is a specific market set-up that provides certain risk/reward characteristics.

I have touted several of my actual, real-time trades in this blog. I laid out the specifics of a shorting strategy in Apple Computer – that trade did not work, but it provided the type of a risk/reward profile I dream about. I only get about ten or so set-ups per year like I had in AAPL.

On April 21, I posted a long strategy in the S&Ps and Nasdaq. I went long the Nasdaq on April 20 and the S&Ps on April 25. The jury is still out on these trades. Currently my stop in the Nasdaq locks in a small profit and my risk in the S&Ps is about 40 basis points.

On March 25 and April 1, I laid out a technical case for a bull move in the emerging stocks markets. I did not play this one in futures, but moved 50 percent of my IRA funds into emerging markets and China between March 23 and March 30. I pointed out this situation before I finalized my trade. The jury is still out on this trade as well.

On April 13, I made the case for being long Soybeans and short Corn. I am in this trade. This is a trade that may require two or three years to fully play itself out, but it is a single trade than could return 20 to 30 percent to a portfolio. I completely understand that in the age of day trading, a trade that requires two or more years to work is not something most of you care much about. But, nevertheless, it is a trade I am carrying and will likely be carrying for a considerable period of time. BORING!

Over the years my trading horizon has gotten longer while the horizon for most traders has gotten shorter. Apparently I am out of step with the world.

So, once again, in my mind, positions are not opinions and opinions are not positions. Yet, in this blog I deal cards out of both decks. Hopefully as readers you will become aware of the deck from which I am dealing in any given blog posting, and will react to the post accordingly. If my opinion runs counter to your opinion or your position, please do not take it personally.

###

8 years of global Silver supply changed hands last week

Value of Silver trading equaled 1.5 times the entire value of NYSE trading

First off, before I say anything more, let me congratulate those of you who sniffed out the bull market in Silver and have made a killing. Whether your reasons for being a long holder of Silver (bullion, ETFs, producers) prove to be right or wrong, you have made a ton of money – and at the end of the day this is what counts. I missed this bull move (although I nailed Gold). I admit it. So, whatever I say about Silver has to be placed in the context of the fact that one of the biggest trends in the history of raw materials took place with me as a spectator, not as a speculator.

With this admission in place, let me get to the subject.

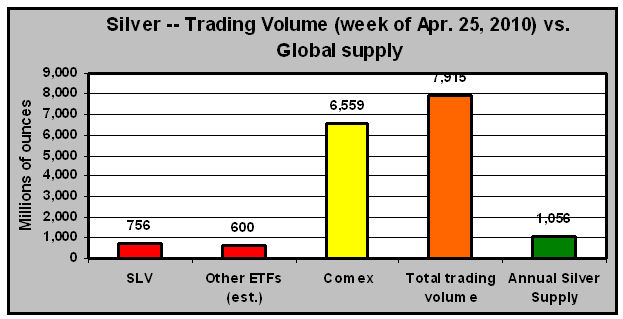
I do not ever recall volume (relative to supply) in any commodity or stock like we witnessed last week in Silver. The entire global supply of Silver in 2010 was approximately 1,056.8 million ounces. This includes Silver from mines, government sales, and scrap, with an adjustment for hedging activities.

Last week’s total trading volume in Silver was at least 7, 915 million ounces, counting the Comex plus SLV and other Silver ETFs. In other words, 7.5 years worth of Silver supply changed hands last week.

Historically, huge slugs of trading volume have been either “starting” volume (the kick-off a trend) or “stopping” volume (the end or beginning of the end of a trend). Exceptions to this rule are almost non-existent, although I am sure Silver bulls would say…”This time it’s different.”

Let me put this volume of Silver trading into another perspective.  To date in 2011 the average weekly value of stocks traded on the NYSE has equalled $259 billion. Last week the value of Silver traded (at an approximate average price of $46 per ounce) was $364 billion.  

The unprecedented volume of last week may very well lead to further sharp price advances. But the odds overwhelming favor the fact that a volume in one week equal to 7.5 times annual global production is the start of an enormous distribution phase. Silver ownership is being moved from strong hands to weak hands.

At best, Silver is likely to undergo an extensive and very broad trading range. The shine is off the coin.

###