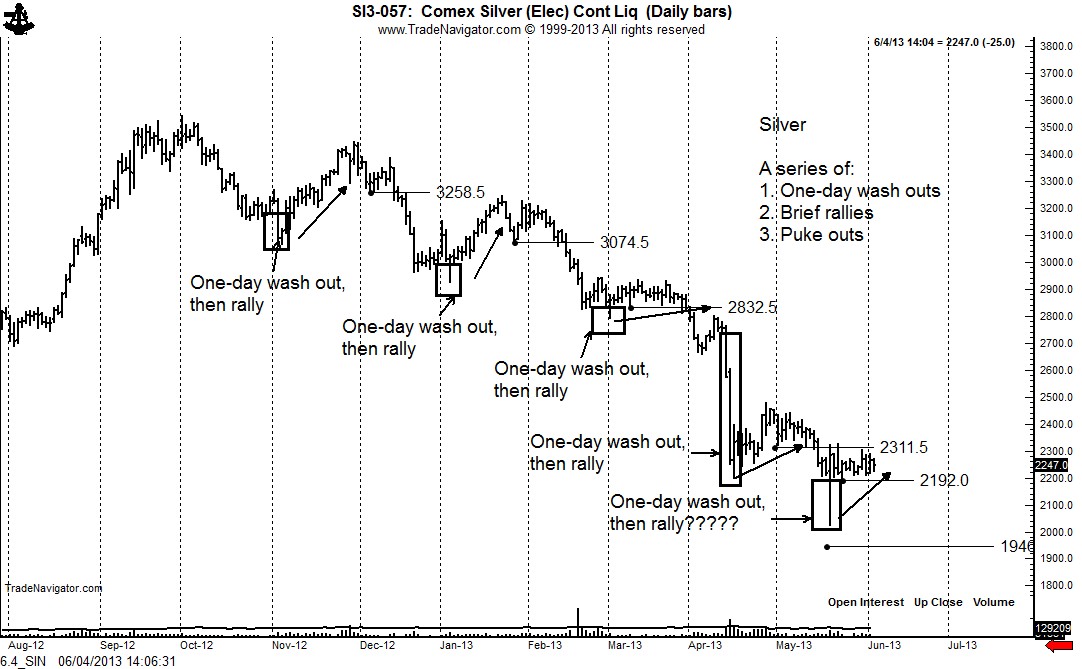
Will Silver continue its cycle of one-day wash outs, brief rallies, then big puke outs
If the cyclic pattern continues, the next down wave in Silver is just around the corner
The entire basis for technical analysis is that price behavior tends to repeat itself in an analog manner. This is exactly what has happened in Silver since November 2012.
The pattern takes the form of three simple stages:
- A one-day spike decline (three days in the case of April) that lacks follow through
- A brief three to four week rally
- Another sharp decline
Interestingly, in each of the four previous recent cases, Stage 3 begins almost immediately after Stage 2 rolls over. The present Stage 2 rally in Silver is anemic at best. The market is unable mount a rally. A decline and close below 21.80 (July “paper” Silver) would likely mean that the Stage 3 puke out is at hand.
The present Gold/Silver ratio is about where is should be. Gold is about 25% over valued relative to its historic relationship to fiat currency. A 25% decline in Silver would be to 16.85, well below my long-standing chart target of 18.75.
The harsh reality for Silver bulls is that Silver is a commodity and subject to booms and busts. There is nothing special about Silver — it is simply a rock mined form the earth. Contrary to what the Silver bulls claim, industrial Silver use is not sky rocketing., but has been flat for years. The biggest growth in consumption has come from investors. But, what would happen if the market went through a period of disinvestment? This has happened in the past.
Silver needs to rally and close above 23.40 in order offset the present negative technical bias.
$SI_F, $SLV
###


Leave a Reply
Want to join the discussion?Feel free to contribute!