Trading as a strategic operation
I am sick of writing about the stock market (although I will touch on it indirectly in this post). In fact, I hope this post will help you understand why I am sick of writing about any market or trade for days upon days.
Rather, I want to communicate a bigger vision of what my trading operations are all about. I am a classical chartists – I look for geometric configurations on price charts.
Specifically, my goal is to capture a majority of the measured move in those chart formations that prove to be among the 10 to 15 best examples of classical charting principles each year. Patterns that earn this title join a spot on what I called my “Annual Best Dressed List.” I publish this list each year in January or February.
“Best Dressed Trades” generally have the following in common:
- A chart pattern on the weekly graph of at least 10 to 13 weeks in duration, preferably longer.
- A daily chart trigger.
- A decisive breakout with little or no pattern re-penetration.
- A steady trend to a target.
When I lock in on these patterns, I engage in a trading campaign that may involve an attempt to pre-position before the breakout, an entry at the point of breakout and opportunities to extend leverage through pyramiding. If a multi-year pattern launches a particular move, I may continue to look for daily patterns as an excuse to be involved for a year or more
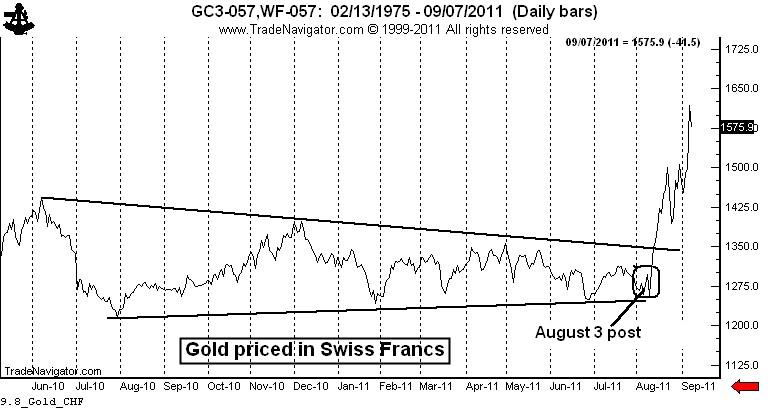
Let me provide two recent examples of “Best Dressed” chart patterns. The first is the Gold/Swiss Franc spread, or Gold expressed in terms of Swiss Francs. The chart below should be familiar to many of you – I featured it a couple of times beginning on August 3 in a post titled, “Gold Prices in Swiss Francs Ready for a Big Move.”
This pattern has already earned its spot on the 2011 Best Dressed List. On August 12 the chart completed a 14-month symmetrical triangle. The target of 1590 was met on September 6, due Gold’s historic run as well as to the Swiss Central Bank’s intervention to drive the price of the Franc lower. Fourteen months to build the pattern – less than four weeks to reach the target!
I doubt if I will ever pay much attention to this chart again. The move is done. I may never see a set up like this again in this particular market combination. I am not interested in why Gold/CHF made this move. I am not interested in Gold. I am not interested in the Swiss Franc. I am interested in chart patterns.
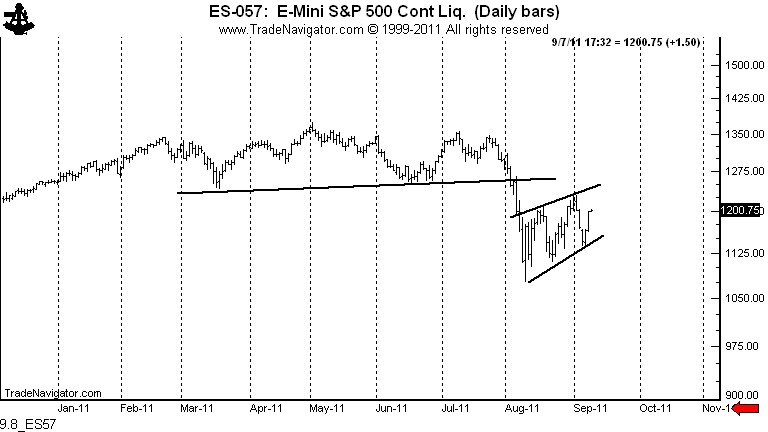
The second example is the S&Ps. The H&S top on the daily chart has met its target – and this chart will also be a member of the 2011 Best Dressed List. But in this case I have a continued interest in the market. Not because I am a stock market bear. Not because I care about the stock market as such. But, because of the charts.
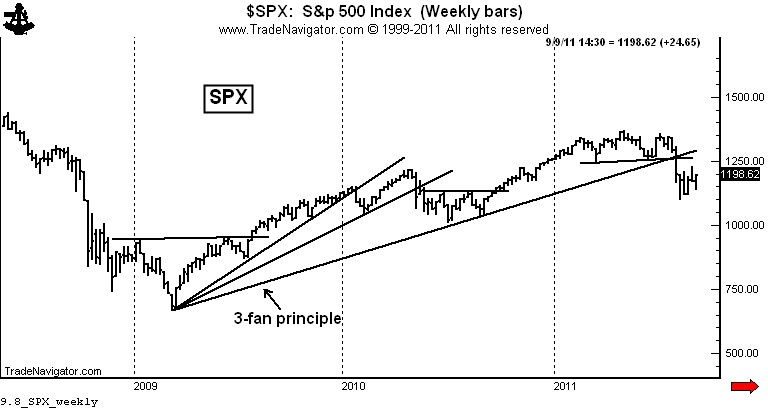
The weekly S&P chart has completed a 3-fan principle, and this implies a decline to the 2009 low. I could care less why the market would or would not go to this price. I only care about the charts. Readers, are you picking up a theme yet?
If it were not for the lower target of the weekly chart I would have absolutely no interest in this current flag or channel or whatever it ends up being (I am reverting back to my original guess that a rising wedge is forming). For me, the current sideways to upward drift is simply a tool to be used as part of a campaign trade. You see, to capture a big move sometimes requires some maneuvering along the way. This flag may fail to materialize. A harder retest could occur. But, I believe we have topped and I believe periods of shorter-term chart confusion will be resolved to the downside.
So, I continue to monitor the stock market. If the S&Ps close above the August 1 high my campaign is done and I may not look at the S&Ps again for weeks. You see, I have no interest in being a stock market bull or bear. I have no interest in the stock market. I have an interest in the charts.
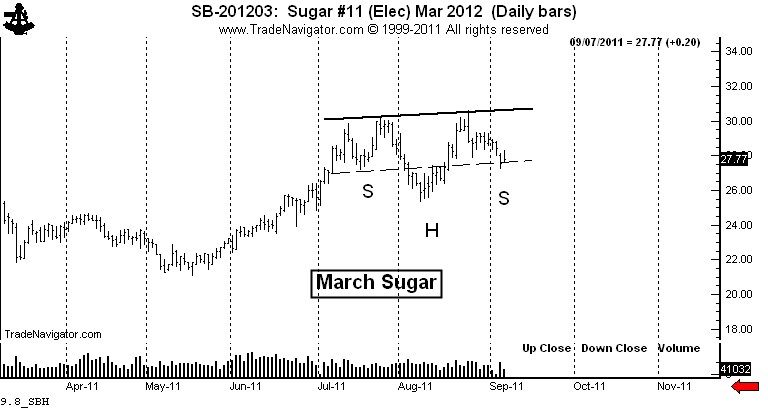
Speaking of campaign trades, I established a light long position in Sugar today (I am out money on the close). I have had a target in Sugar of 60 cents for two years. I alerted you to a tradable bottom on May 27 in a post titled, “If you are a Sugar bull, this post is for you.” The daily chart displays a possible 8-week continuation H&S pattern, what some modern chartists might call a cup and handle. I do not like this pattern description.
My purchase today falls under the category of an “anticipatory” position – attempting to pre-position for the completion of the pattern. I am risking the trade to Tuesday’s low. If I am stopped out, the interpretation was wrong and it will be back to the drawing boards. I have no idea whether this attempted entry into this campaign trade will work. In the bigger scheme of things, whether it works or not really doesn’t matter.
I am not interested in being a Sugar bull. I am not interested in the crop inCubaorBrazil. I am not interested in consumption patterns. I am not interested in Sugar. I am interested in chart patterns.
I am interested in identifying those chart formations that will be among the best examples of classical charting principles this year. I am interested in finding low risk entries that skew my reward to risk relationship into a dramatic asymmetrical profile.
Markets: $SPY, $ES_F, $SB_F, $SGG, $ZM_F
###


Trackbacks & Pingbacks
[…] Trading as a strategic operation | PeterLBrandt. Bookmark on Delicious Digg this post Recommend on Facebook share via Reddit Share with Stumblers […]
Leave a Reply
Want to join the discussion?Feel free to contribute!