The Monthly – December 2020
Symbols covered in this Monthly include the following:
- TSLA
- NASDAQ
- AAPL
- NFLX
- CHTR
- CRWD
- 2318.HK
- 0027.HK
- 1184.HK
- GDXJ
- SLV
- T-Notes
- BMY
- Platinum
- CHF futures
- CN50
- Bitcoin
SSR Move Underway
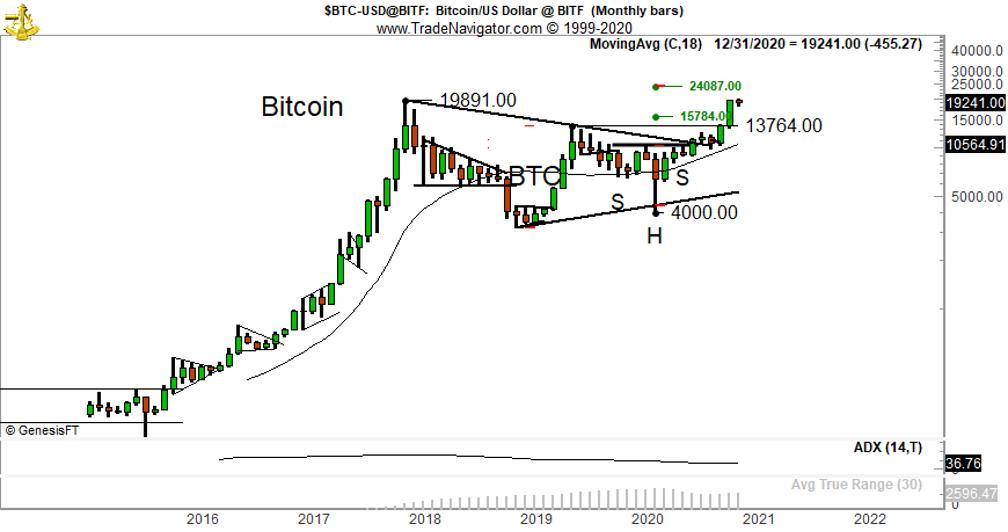
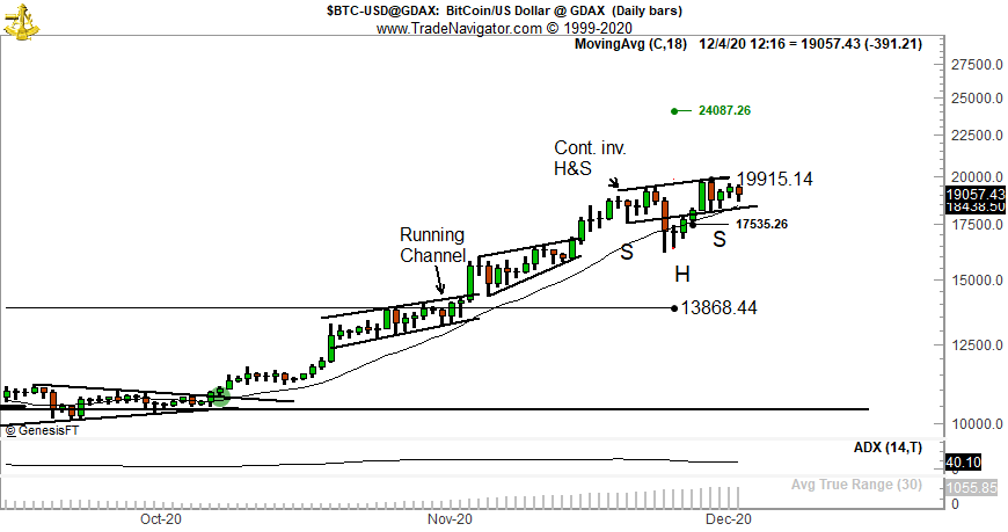
BITCOIN
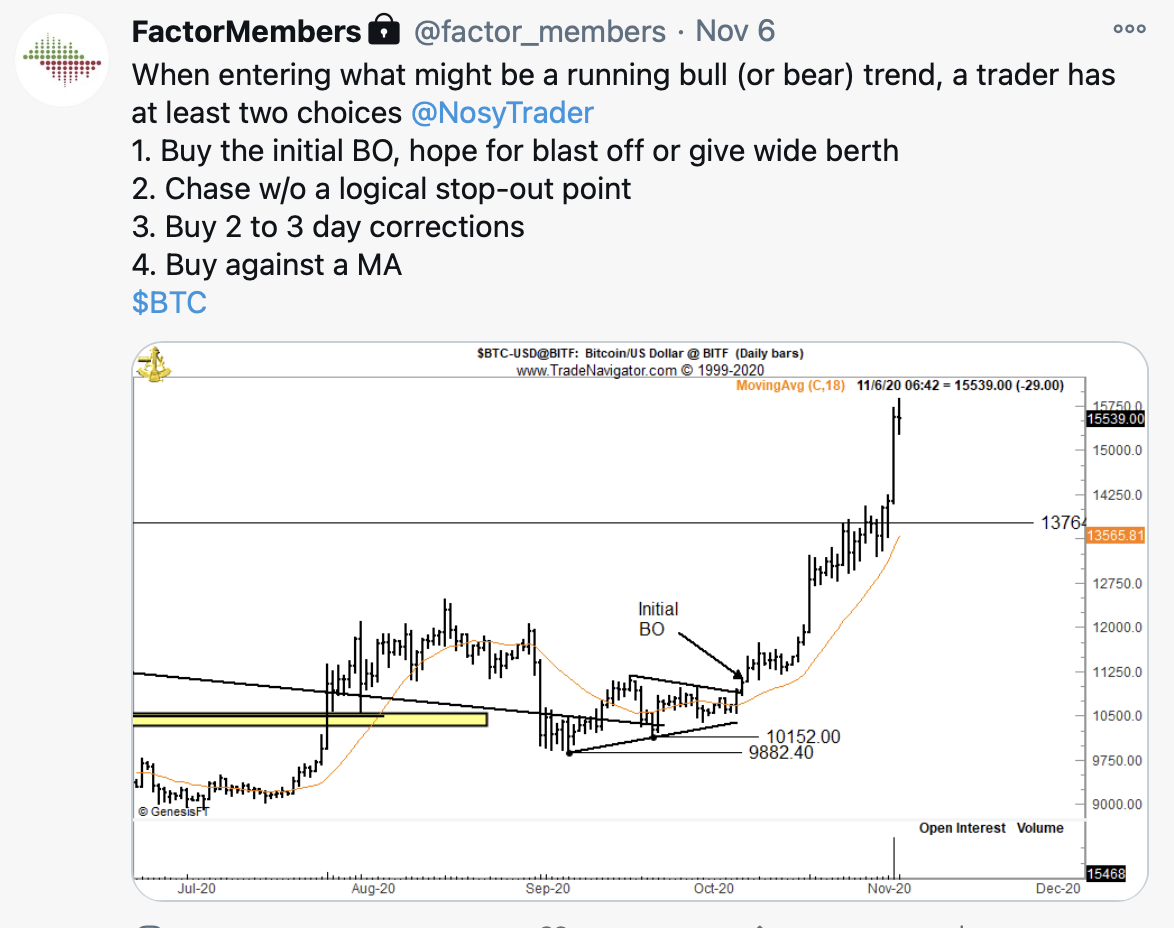
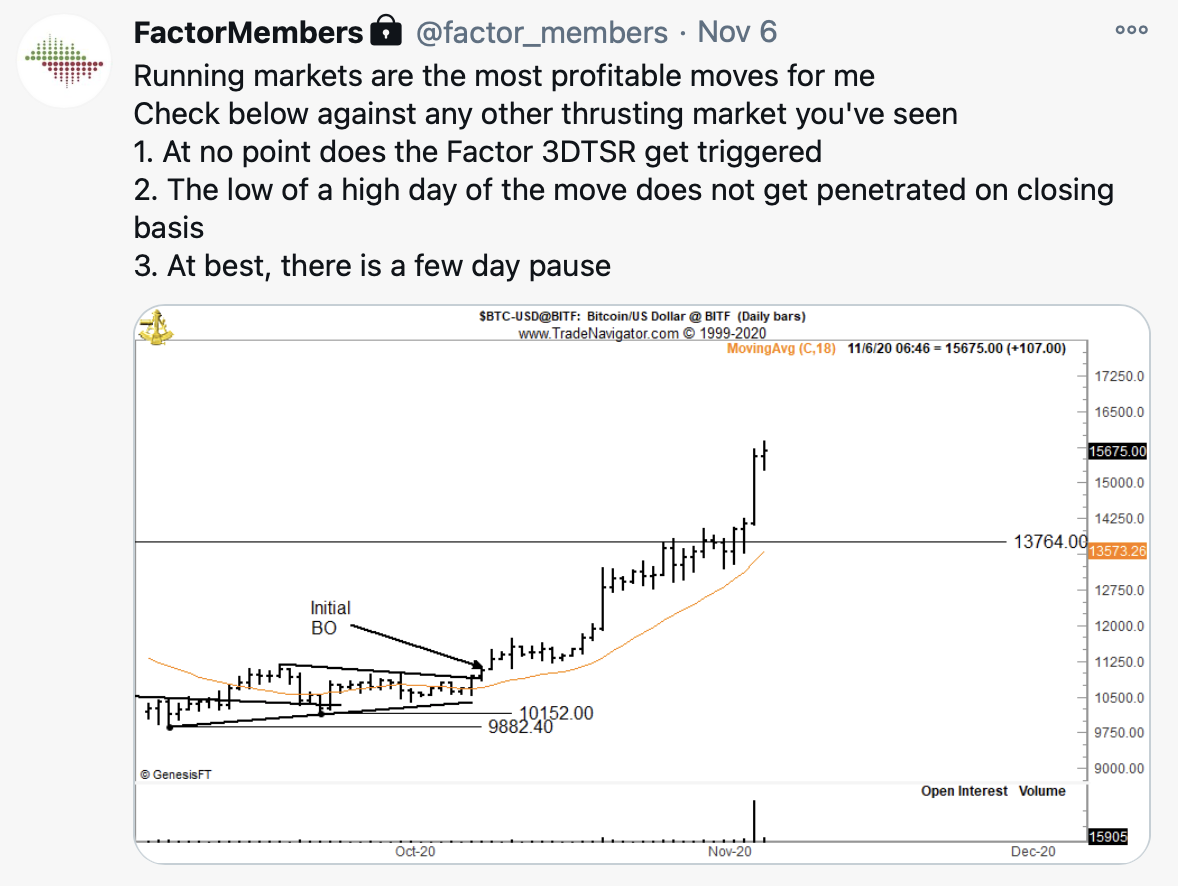
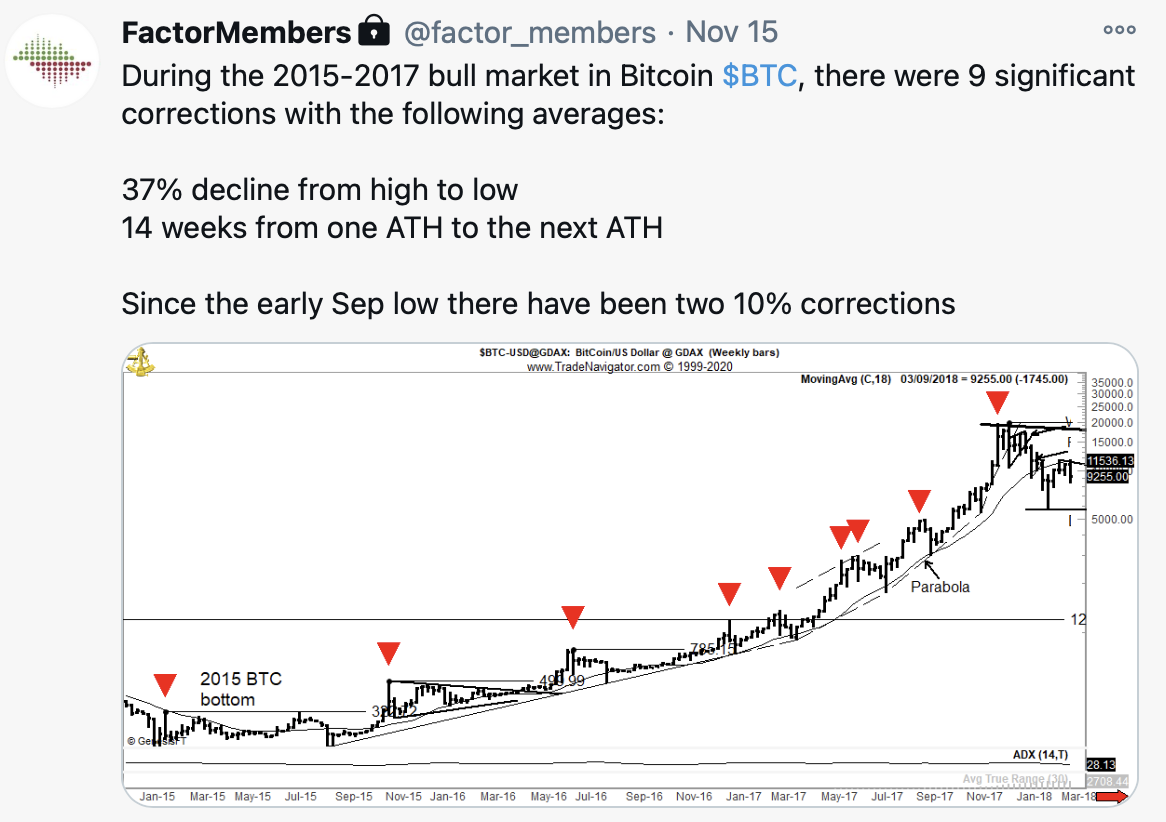
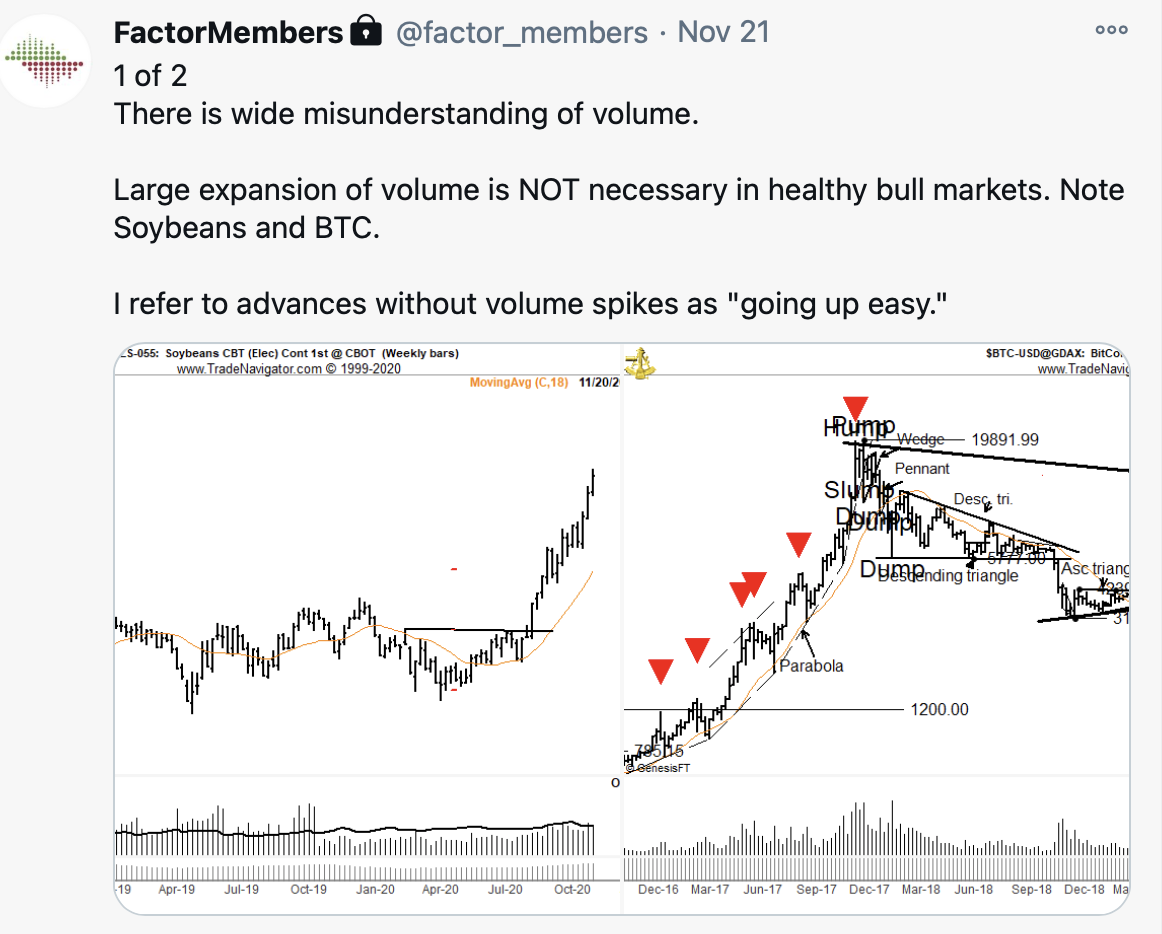
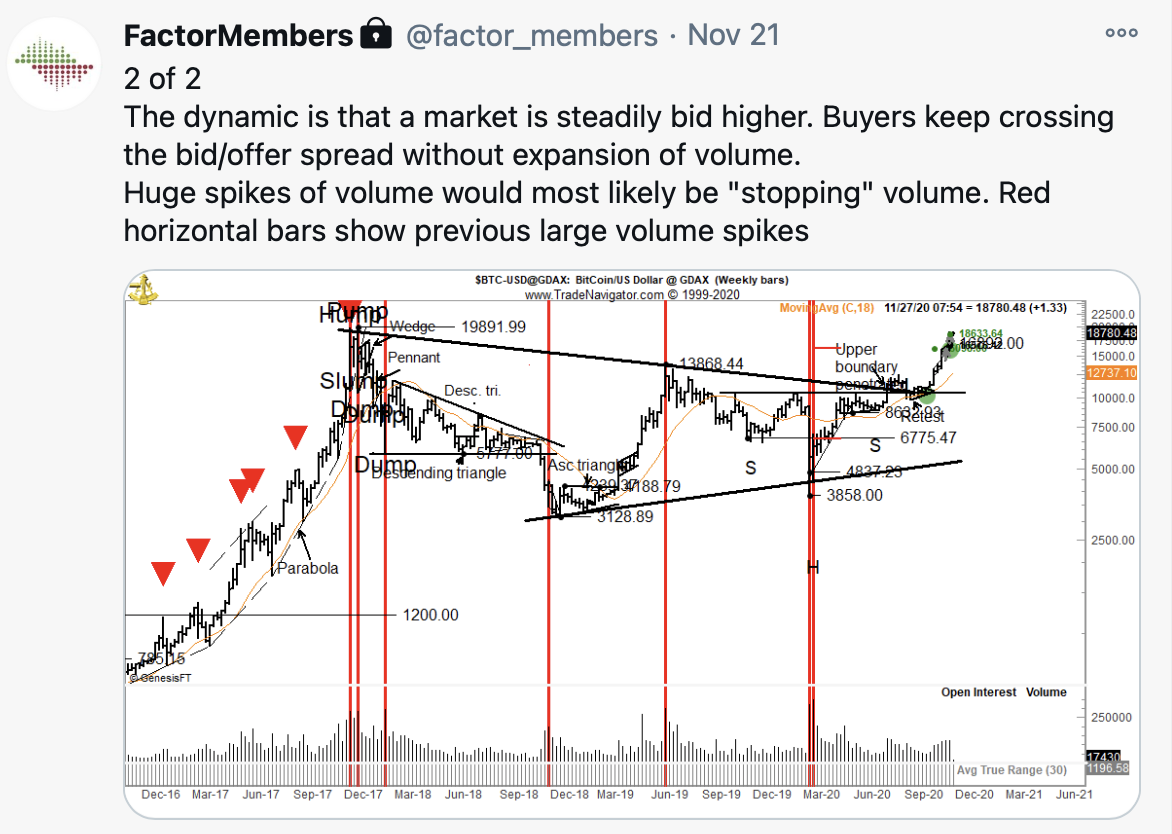
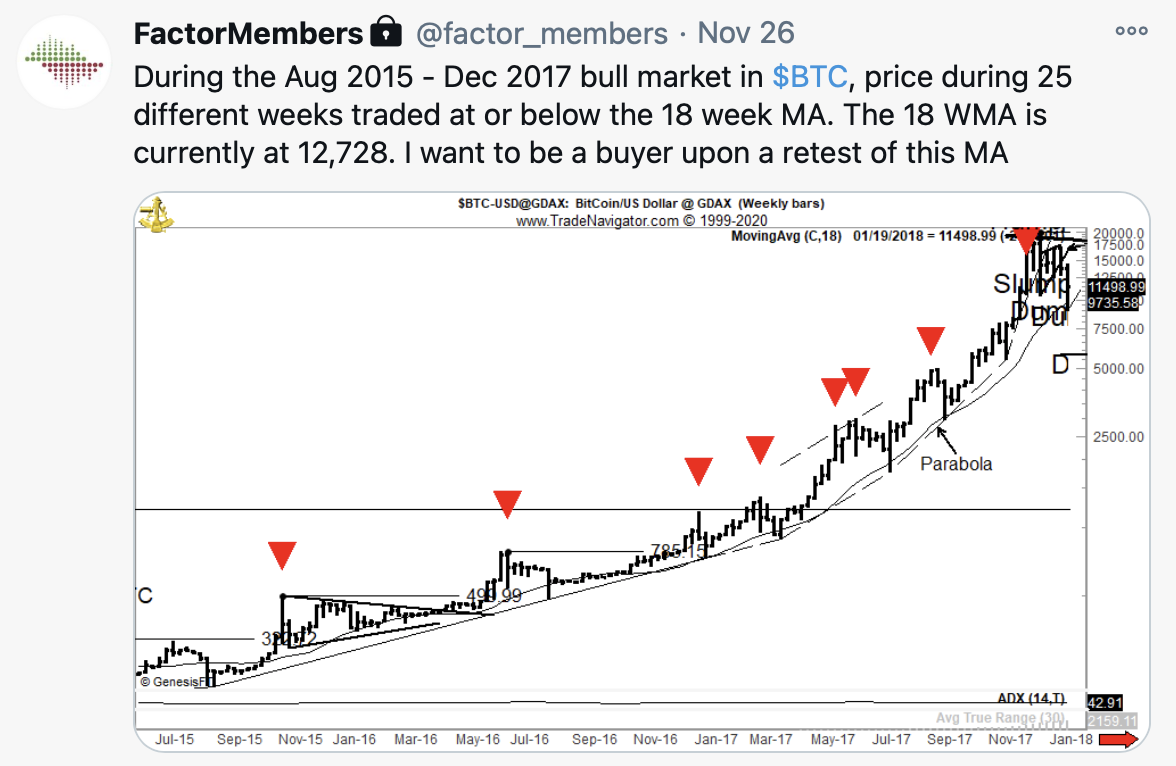
See SSR dated Jul 28. For all practical purposes, Bitcoin has made a new ATH. I use semi-log scale on cryptos and periodically on the monthly charts of equities and metals. The next target for BTC is 24087. Should a substantive correction occur, I would expect support at the Jun 2019 high of 13760 or so. In any case, those among you who are hoping for a straight and uninterrupted “Moon” should expect volatile times ahead. Remember that during the 2015-2017 bull market there were nine corrections greater than 30%. The daily chart exhibits a possible continuation H&S construction. A decline below 17535 would negate this interpretation.
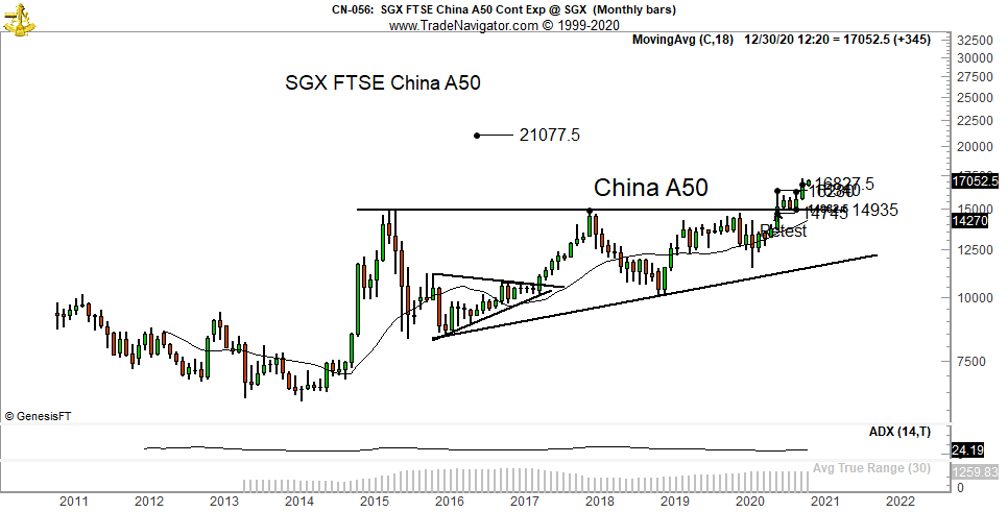
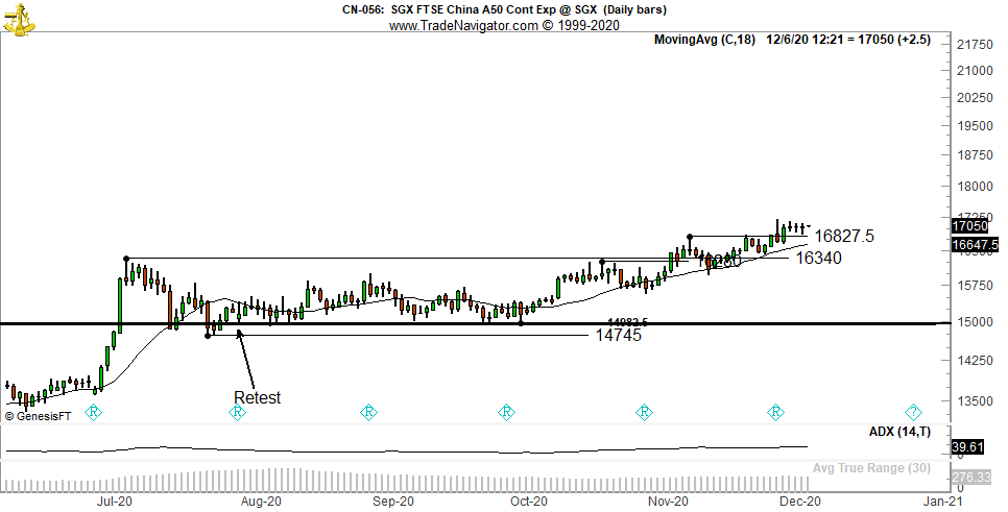
China A50
See SSR dated Oct 17. The monthly chart is the story – a multi-year ascending triangle. The breakout of this pattern in Jul has been working irregularly, but steadily higher. I am extremely constructive on all of Asia – and it is impossible to be constructive on Asia without being constructive on China.
I have found that global equity markets while lacking the liquidity of the U.S. markets, offer some real hidden gems. The single most profitable stock trade ever for me was an Italian company traded on the Swiss Stock Exchange. One always must be aware of the foreign exchange risks to trade global equities. I asked my friend Aksel Kibar of @TechCharts to prepare an analysis of three stocks in China (Hong Kong) that he thinks offer outstanding potential. You will find Aksel’s analysis as an appendix to this edition.
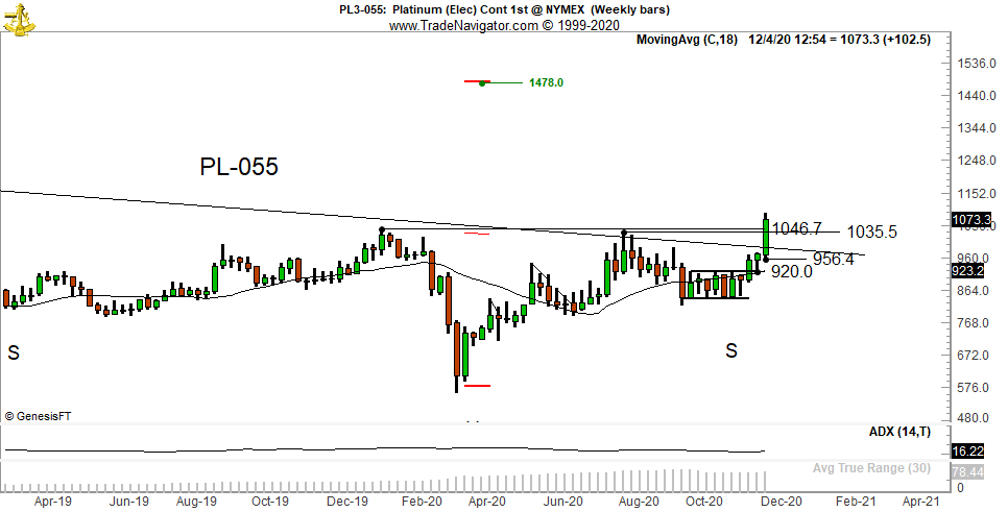
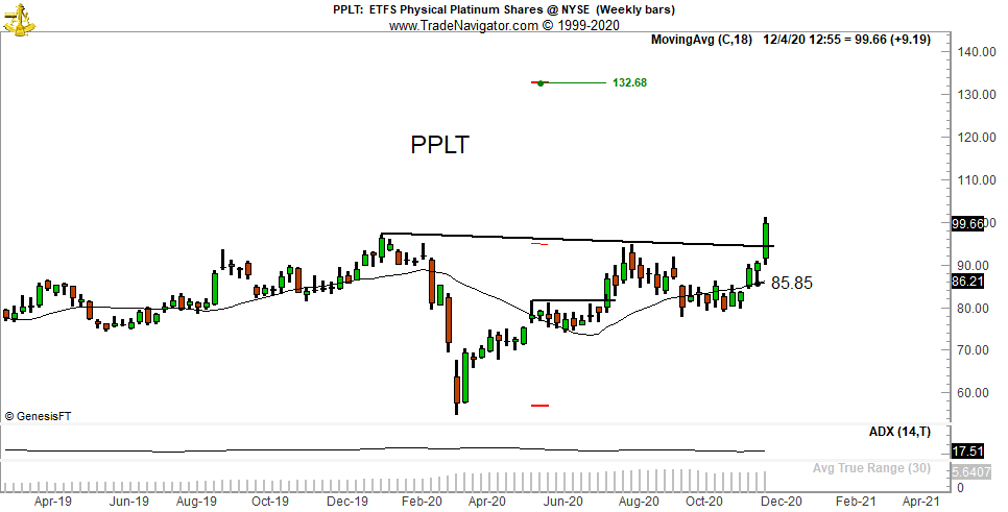
Platinum
See SSR dated Dec 4, 2020. The advance this past week completed a large, inverted H&S bottom in Platinum and PPLT, the Platinum ETF. I am sure there are other stocks/ETFs that express this theme. The target for Platinum futures is 1478 and 132 for PPLT.
Markets on the radar screen as previously issued or pending Special Situation Reports (SSRs)
Silver (covered in the Jul 21 Raw Material SSR)
I believe that Silver is headed for substantially higher prices. The How and When are the big questions. I would have closed my eyes and bought SLV has spot Silver moved below $21 this past month. I will monitor the daily chart for an indication that the dominant bull trend has resumed.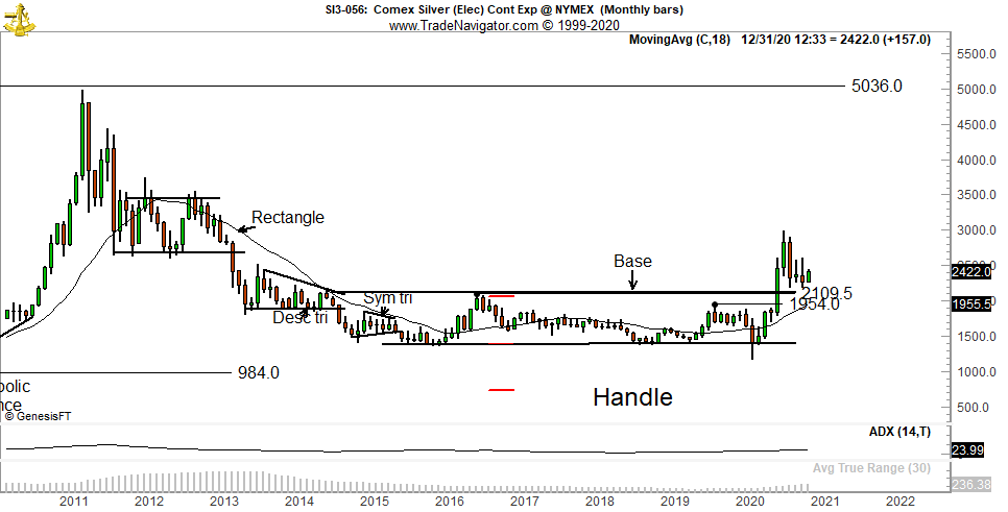
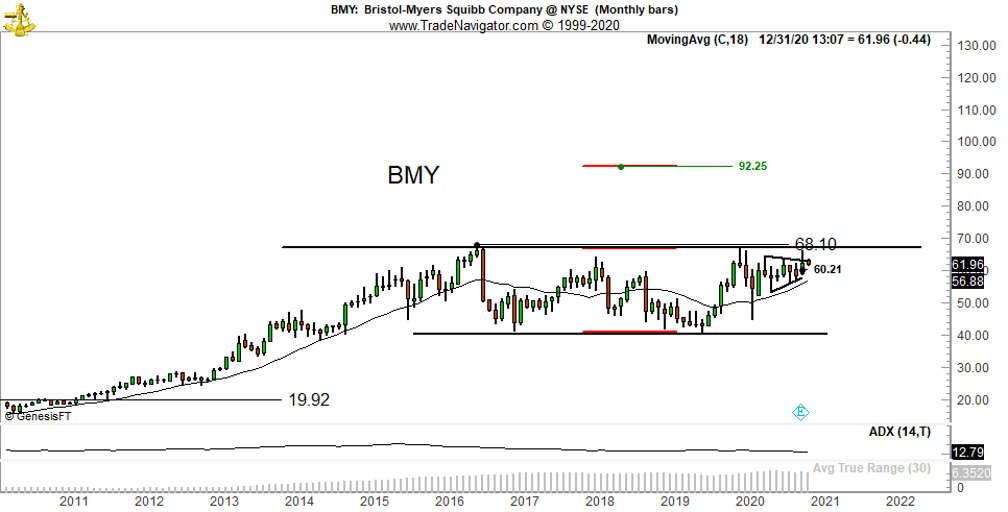
BMY
See Factor SSR dated Nov 4, 2020. The long-term chart continues to appeal to me. This SSR will be re-ignited if BMY can clear resistance at 68.10.
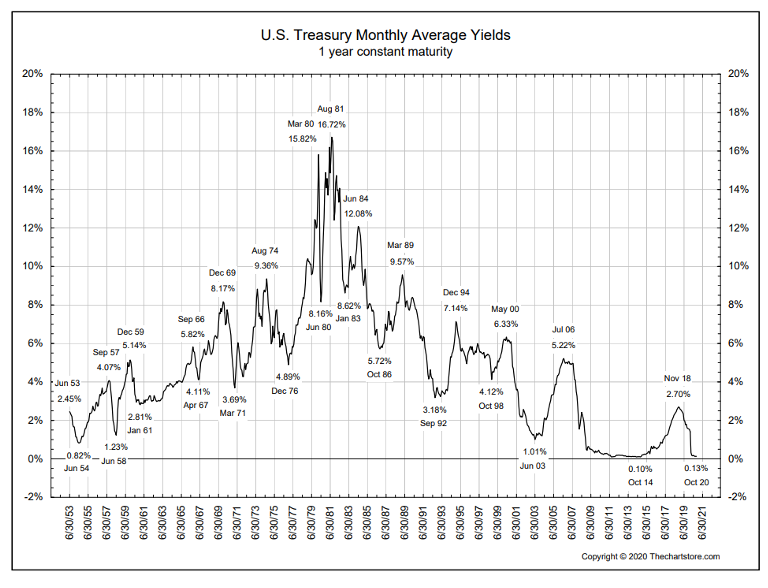
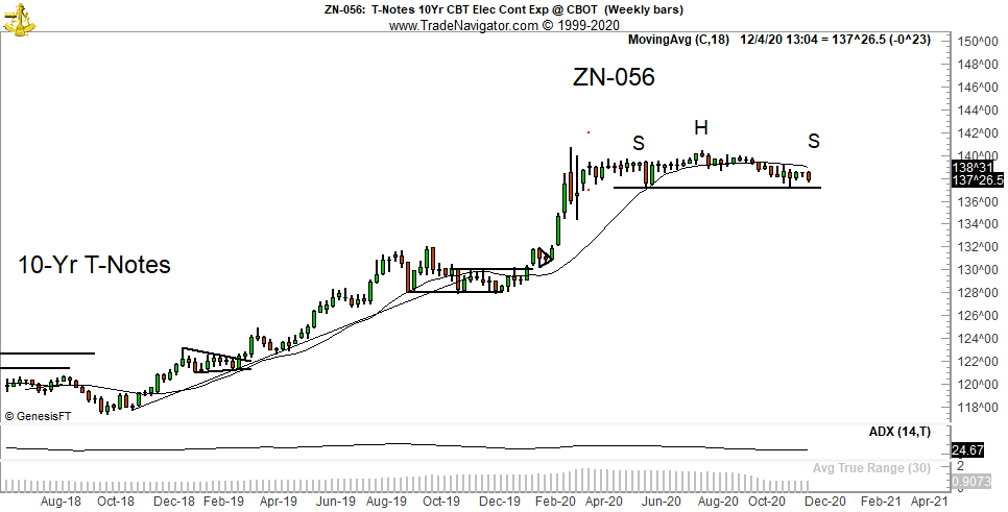
U.S. Treasuries
U.S. interest rate yields have been in a historic decline and are equal or below the lowest yields in the past 100 years, depending upon the maturity. I am interested in the long side of yields (the equivalent of the short side of Treasury futures). The weekly chart of the 10-Yr Note is a right shoulder shy of a nicely formed top.
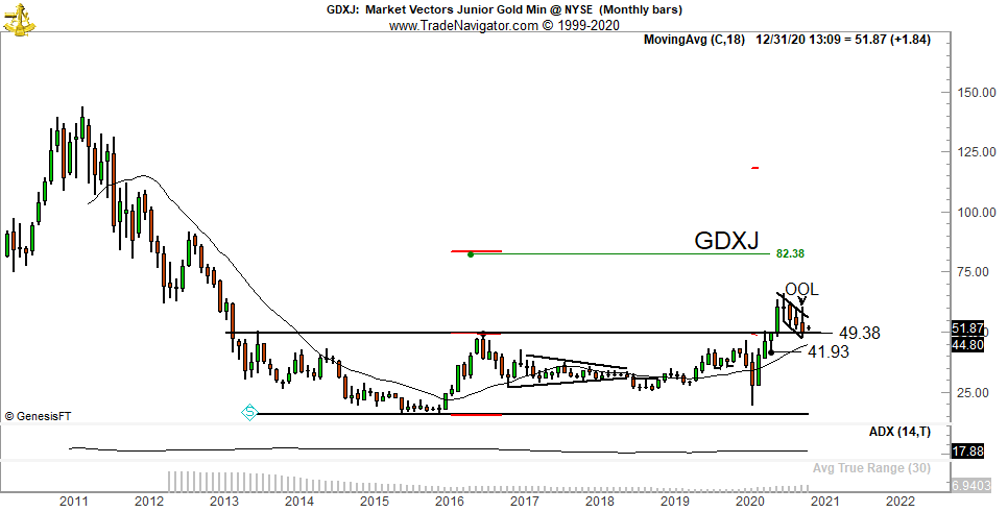
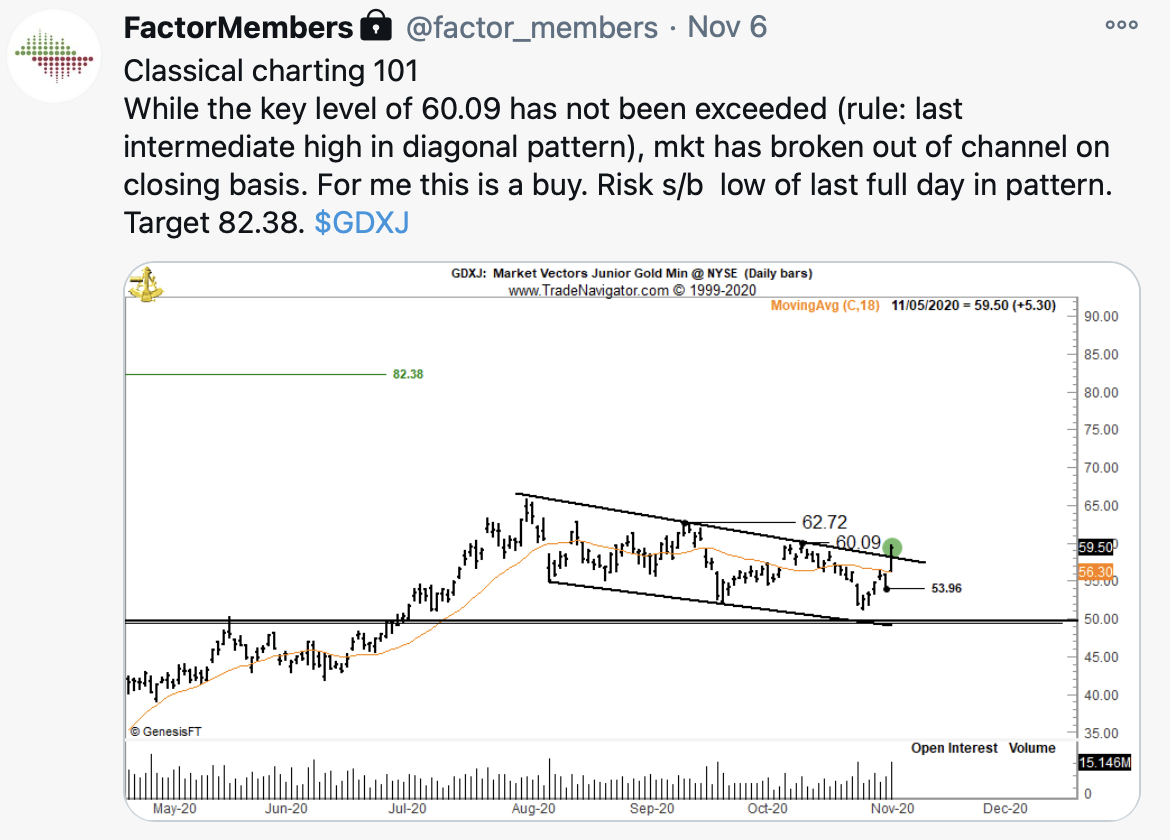
GDXJ
The monthly chart of the Juniors held the upper boundary of its massive underlying rectangle. I am extremely interested in the long side of this ETF, but the market lacks a classical chart bottom.
Other weekly charts worthy of note
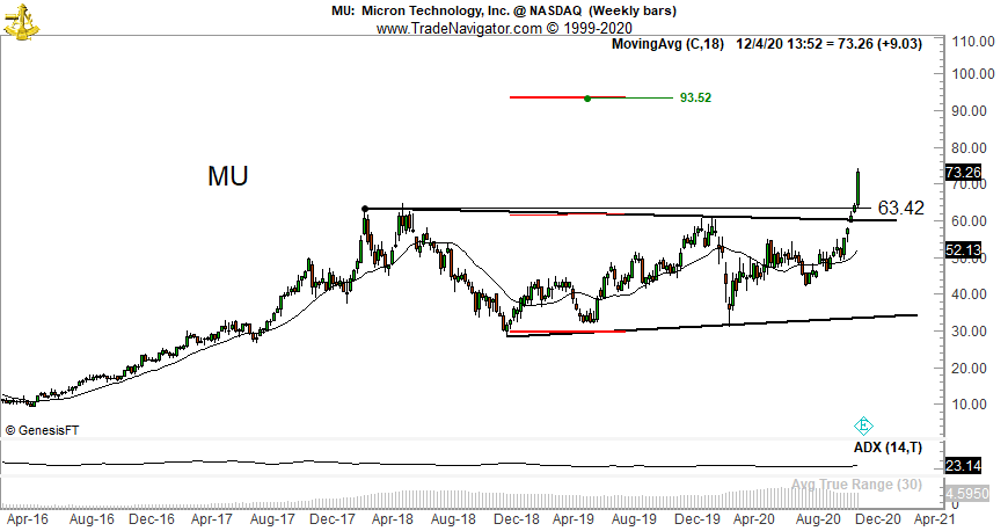
Micron
This stock completed a significant continuation chart this past week. Had I not been preoccupied with some other things I would have put out an SSR on MU – coulda, woulda, shoulda.
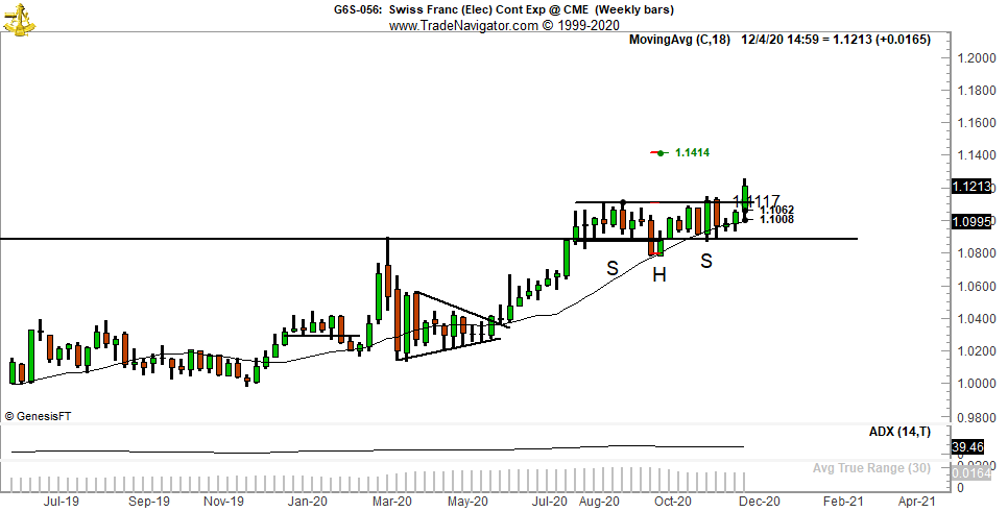
CHF futures
A 4-month continuation H&S pattern was completed in Swiss futures this past week.
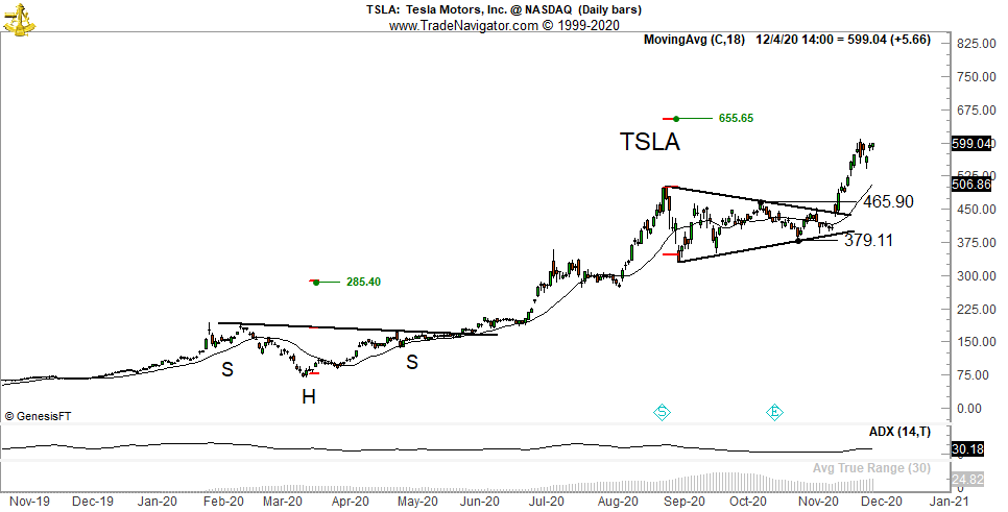
TSLA
The 655 target is within reach now. As a side note, a 3-day trailing stop rule has not been triggered. This would indicate that the market is advancing on bids.
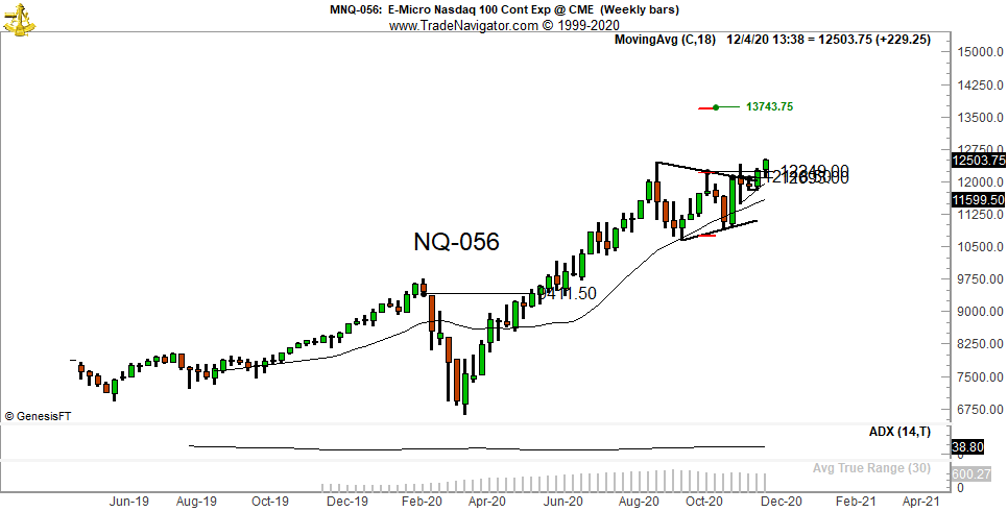
NASDAQ
The weekly chart suggests that this current run up should reach 13743 or so.
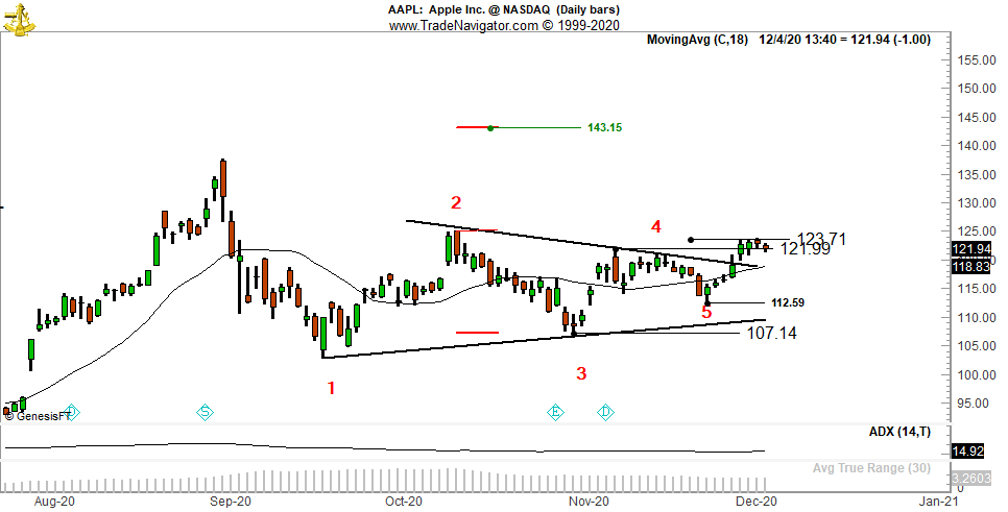
AAPL
Apple should work its way to 143, pending a close above 123.71. A decline below 112.59 would negate this interpretation.
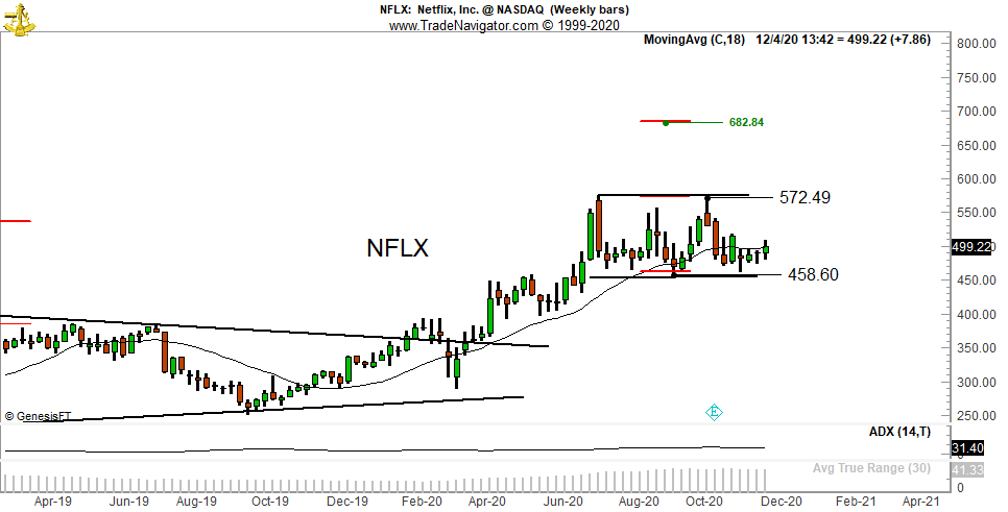
Netflix
This rectangle could be a top – my guess is that it will become a continuation pattern.
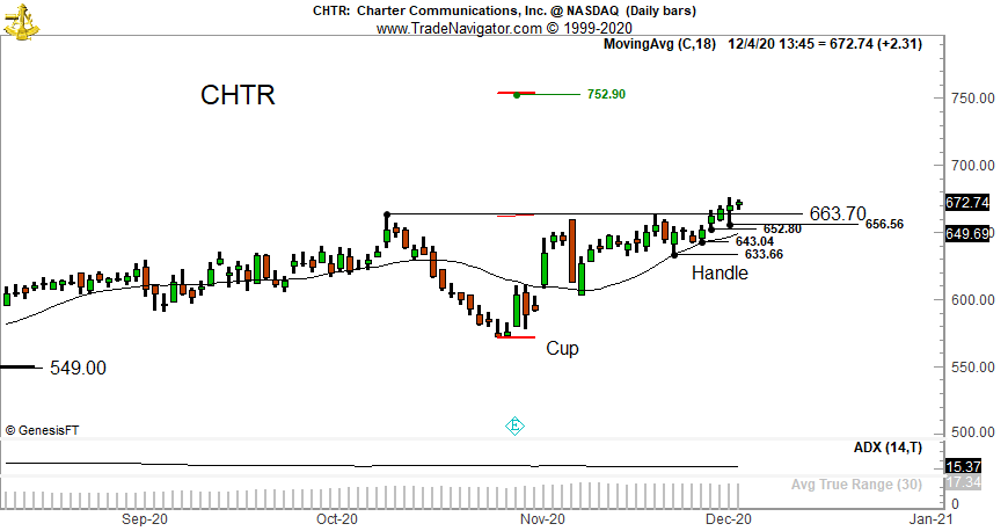
CHTR
I wish this cable provider serviced Oro Valley. I have only heard great things about this company. Comcast’s service is terrible. A Cup and Handle (alternative view is that of an ascending triangle) has been completed in this stock.
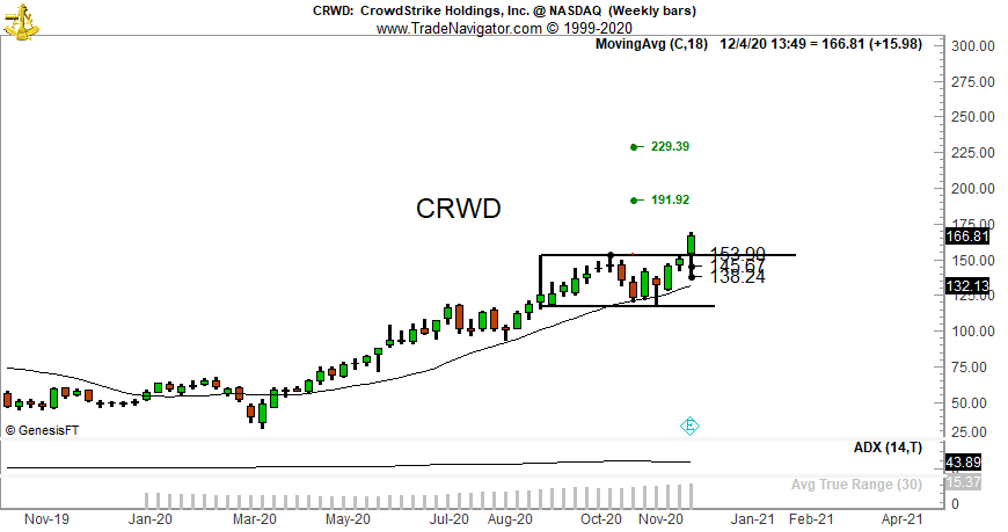
CRWD
A 14-week rectangle was completed in this stock this past week. Rectangles between 8-10 and 26 weeks are my favorite patterns.

Analysis by Aksel Kibar of Tech Charts
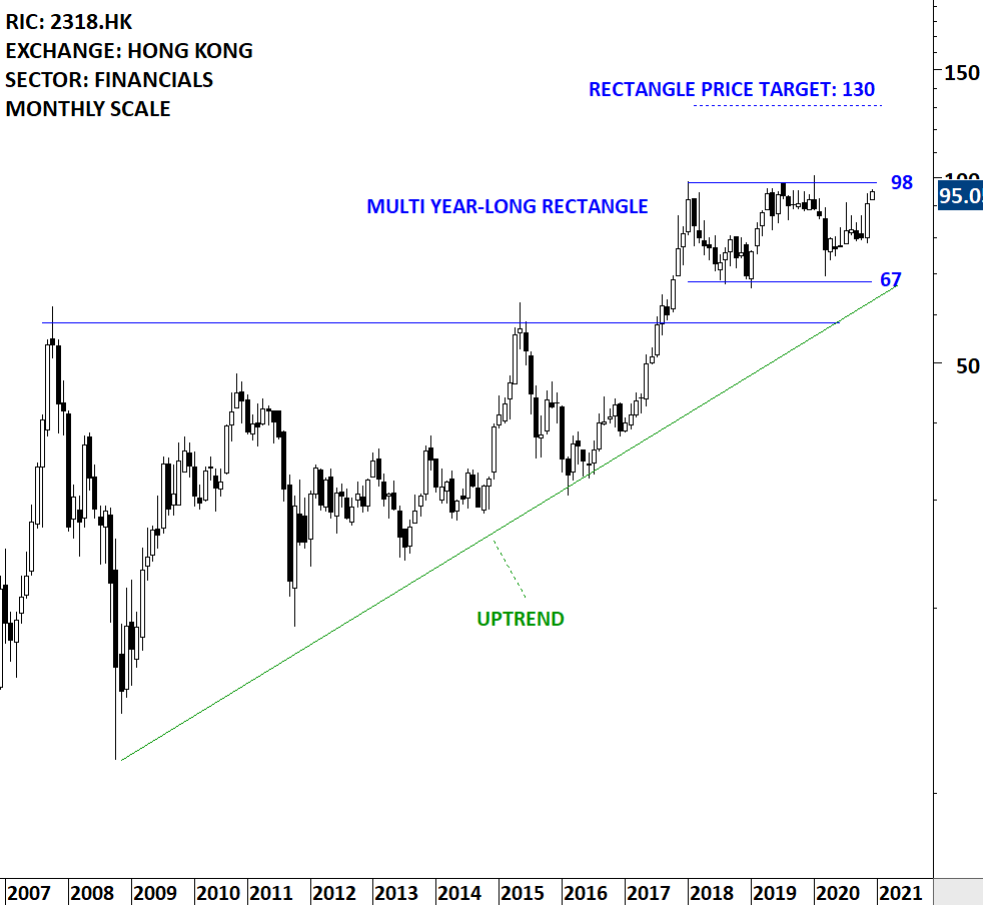
PING AN INSURANCE GROUP CO OF CHINA LTD (2318.HK)
Ping, an Insurance (Group) Company of China, Ltd. is a personal financial services provider. The Company provides insurance, banking, investment, and Internet finance products and services. The stock is listed on the Hong Kong Stock Exchange. Price chart formed a 3 year-long rectangle with the horizontal boundary acting as strong resistance at 98 levels. The horizontal boundary was tested several times over the course of the chart pattern. Breakout from the 3 year-long rectangle can push the stock to its possible chart pattern price target of 130 levels. Ping An Insurance has been in a steady long-term uptrend and breakout from the latest consolidation can push the stock to all-time highs.
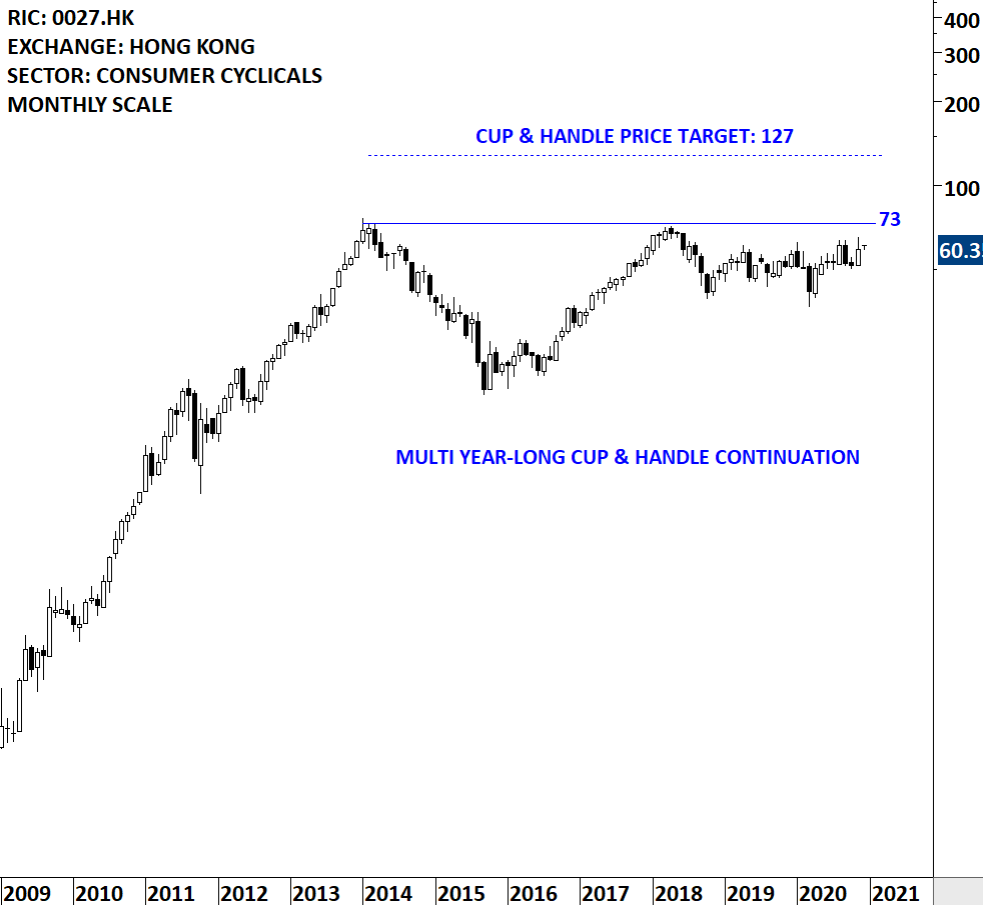
GALAXY ENTERTAINMENT GROUP LTD (0027.HK)
Galaxy Entertainment Group Limited (GEG) is a hospitality and gaming company. The Company develops and operates hotels, gaming and integrated resort facilities in Macau. The principal activity of the Company is investment holding. The Company, through its subsidiaries, is engaged in operation in casino games of chance or games of other forms, provision of hospitality and related services in Macau, and the manufacture, sale and distribution of construction materials. The stock is listed on the Hong Kong Stock Exchange. Price chart formed a multi year-long cup & handle continuation with the horizontal boundary acting as strong resistance at 73.00 levels. Breakout above 73 levels will confirm the long-term continuation chart pattern with the possible price target of 127 levels. Breakout can push the stock to all-time highs.
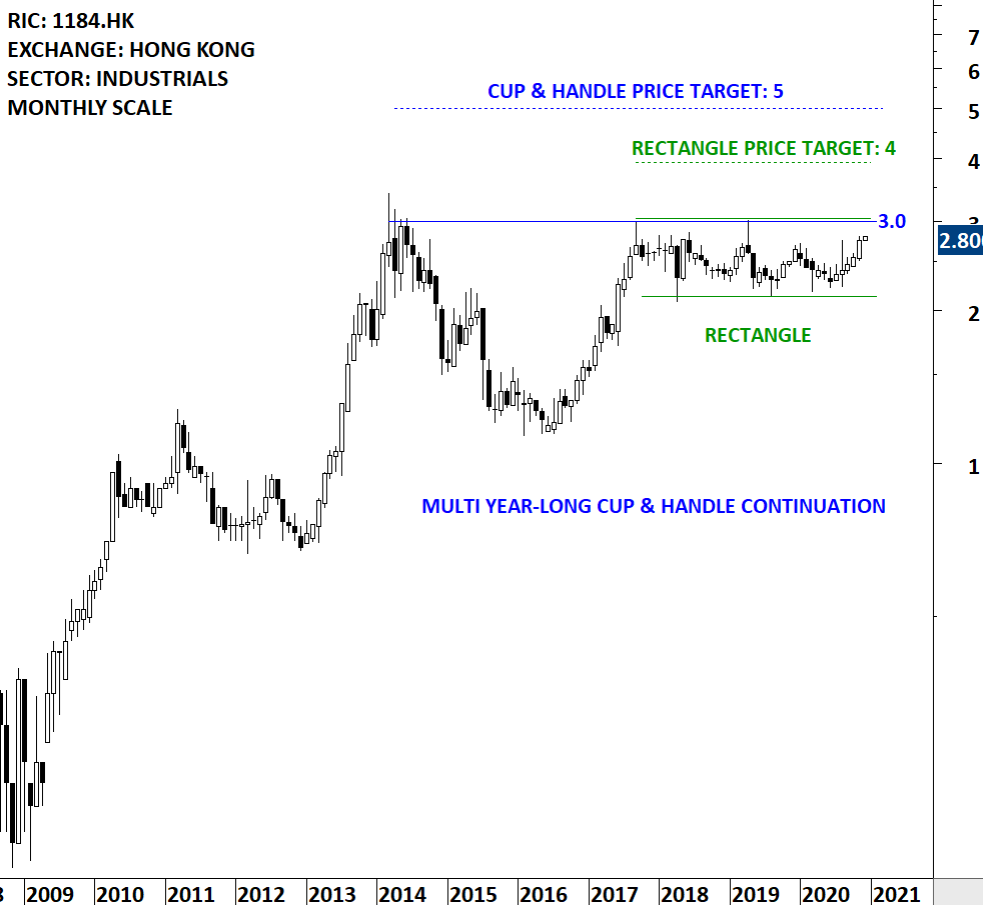
S.A.S. DRAGON HOLDINGS LTD (1184.HK)
S.A.S. Dragon Holdings Limited is an investment holding company principally engaged in the distribution of electronic components and semiconductor products. Its products and services mainly include chipset solutions, display panel, memory chips, light-emitting diode (LED) lighting solutions, power supply system solutions, multimedia system solutions and other premier solutions. The stock is listed on the Hong Kong Stock Exchange. Price chart formed a multi year-long cup & handle continuation with the horizontal boundary acting as strong resistance at 3.0 levels. The handle part of the chart pattern can be identified as another long-term rectangle. The horizontal boundary was tested several times over the course of the chart pattern. Breakout above 3.0 levels confirm both chart patterns at the same time. Price target for the rectangle stands at 4 and for the longer-term cup & handle at 5.0 levels.
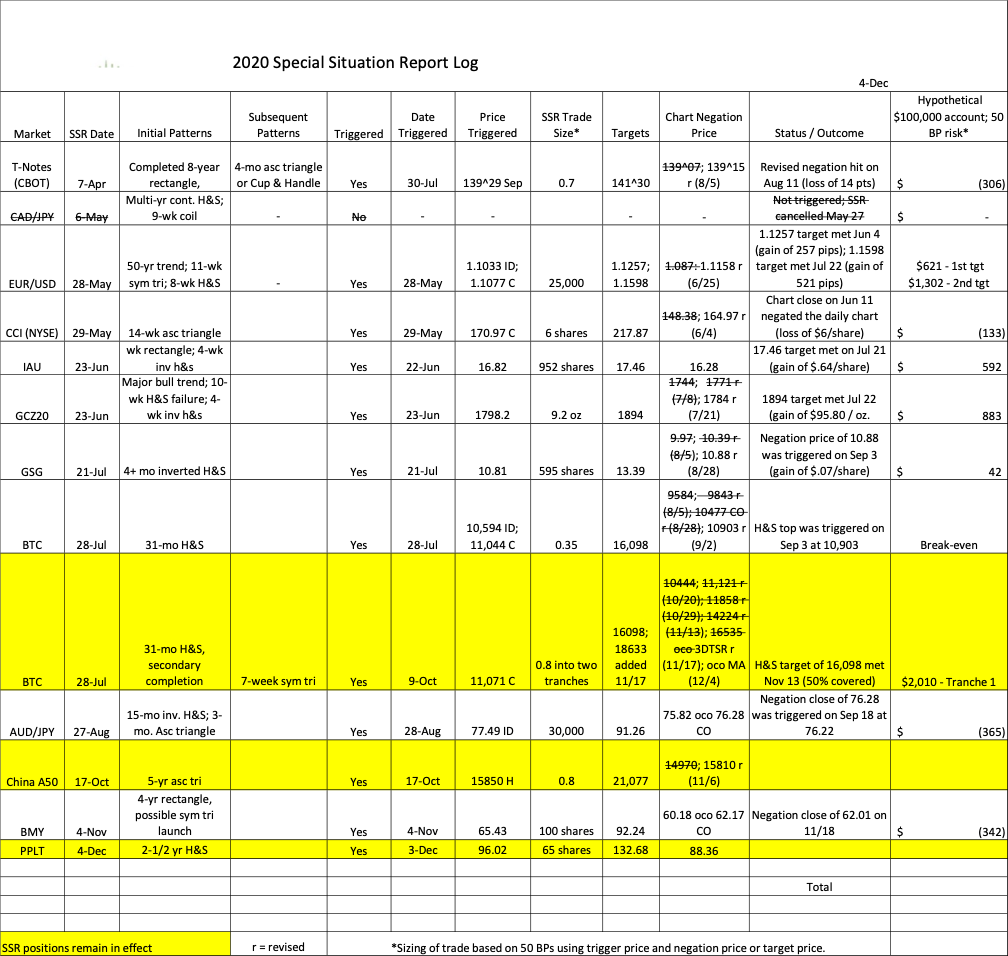
2020 Special Situation Report Log
You will note that some modifications have been added to the SSR Log. One column reports a hypothetical outcome of the SSRs. This is derived by calculating a 50 BP trade using the Price Triggered and the initial Chart Negation Price (or target if it is reached).
See ongoing postings on the @factor_members private Twitter feed (simulcast on the Factor Member website). Steps for access.
Spotlight Tweets – Factor Member Private Twitter
Are you following our private Twitter? Steps for access
From our Content Library
Factor Member Q&A November 20, 2020

Spotlight Links
- CFA Magazine interview (2018)
- What Trading Over the Course of Five Different Decades has Taught Me About Drawdowns (2015)
- A Brief Introduction to Probability Theory and the Random Distribution of Results: Understanding the Concept of Sequencing in a Trading Operation (2014)
PDF Version