Copper breaking critical support
A strong down day today could place a top on the Copper market
The Copper market is in technical trouble. The market has been coiling within a symmetrical triangle pattern since October 2011, as seen on the weekly graph below.
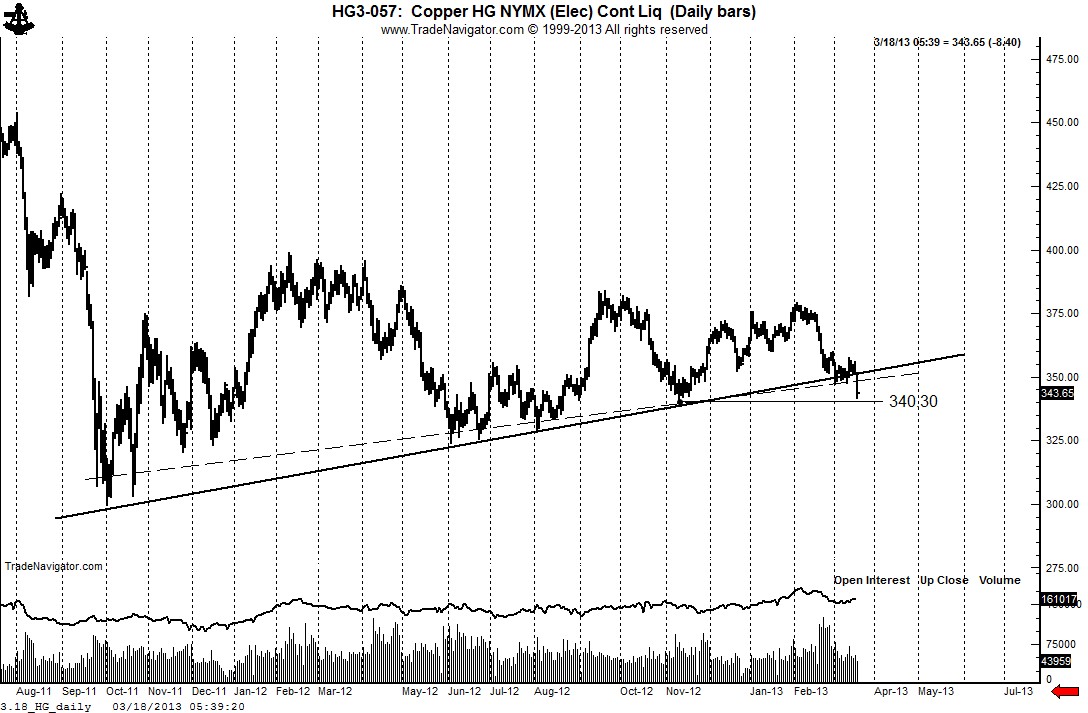
The decline today, if it follows through, would close below the lower boundary line of the triangle and also below the early March low. The solid boundary line connects the orthodox weekly lows, the dashed line connects the lowest Friday closes.
The daily chart mirrors the weekly chart and shows the import of today’s current decline. The market has one more major hurdle before we declare it a full-fledged bear market — the November low at 340.30 must be penetrated on a closing basis. Should this occur the target would become a minimum of 300.00. The red dashed line once again is the boundary line based on the closing price chart (not shown).
Markets; $HG_F, $JJD
###


Trackbacks & Pingbacks
[…] a post by a respected technician Peter Brandt. His posts are not as frequent as they used to be, but you can sure bet when he posts something […]
Leave a Reply
Want to join the discussion?Feel free to contribute!