How random probability theory can make the difference between losing and winning with the same exact trading plan


Most traders obsess over win rate, bet size and the payout ratio. Yet, they do not comprehend one of the most important variables of all — random probability theory.


[scribd-doc doc=”264964196″ key=”QHCV56rT7sKfHSsOXEuK”]


###

Some shorter-term charts that are ready to move

Nasdaq ($NQ_F, $QQQ), S&Ps ($SPX, $ES_F), Apple ($APPL), NYSE Composite Index ($NYA) and Nike ($NKE) appear ready for a strong advances

Hey all you stock market bears, get prepared to fade these breakouts!


4.23_AAPL 4.23_ES_D 4.23_NKE 4.23_NYA 4.23_QQQ

Analyses of these charts — and many others — are routinely provided to members of the Factor Email Service (see upper menu bar)


###


Free copy of Factor Update report for April 19, 2015


[scribd-doc doc=”262584889″ key=”VAhl3p6sSQ6U5iqMFrxA”]

A technical analysis of the old crop Soybean charts — A MUST read for all farmers and ag businesses


The 2014/2015 Soybean chart strongly suggests a decline to $7.50 and lower

[Note: Factor LLC is a proprietary trading and research firm dating back to 1981 at the Chicago Board of Trade. Since inception, Factor LLC has traded its own capital using classical charting principles. Sometimes the charts are right — sometimes they are wrong. But when a large weekly chart pattern presents itself in the grain markets, traders, farmers and ag businesses must be alert for the possibility indicated by the chart.]

Factor LLC has created a proxy chart for the 2014/2015 Soybean crop year by splicing together the life-of-contract graph of the expired 2014 November Soybean contract with successive delivery months.

The picture is not pretty. Farmers….ignore it at your own risk!

The proxy old-crop Soybean chart completed a massive 3-1/2 year H&S top in mid-July 2014. The market then drifted sideways until late August before drop sharply to the $9.04. Soybeans then rallied into a mid-November retest of the neckline of the H&S top. The July 2015 contract is presently about $1 lower than the mid-November high.

3.30_ZS_W

Factor LLC believe the Bean market is just buying time before a sizable decline. There is a strong seasonal tendency for Soybean prices to top when planting is complete and bottom when the crop is in the bin. The seasonal should exert some upward or sideways pressure through early to mid May. Farmers should use any strength during the next six weeks to sell old crop Soybeans and hedge new crop Beans. The pattern target of this H&S top to $8.25. The swing target is to $7.25.

3.30_ZS_seasonal

Of course, farmers will say to themselves and each other…

“No way can Beans go to $8.25 much less $7.25. Beans have averaged $12 (at the CBOT) for seven years and I cannot make money at $8. Besides, I have $1 million in new equipment to pay for. “

Unfortunately, the market could care less about the cost of production in the short term. The chart below tells a real story. From 1983 through 2007 the average carryout-to-usage ratio of Soybeans was 12.5% — prices at the Board averaged just north of $6.50. The past seven years have been historic, with an average carryout-to-usage ratio of 4.7%. This is why prices have been high since 2007 — and the only reason. The USDA projected carryout-to-usage ratio for the 2014/2015 old crop Beans is 10.4%. But there is more bad news. The current Soybean/Corn ratio is 2.6 to 1. This will encourage farmers to plant even more acres to Beans than were reported today –setting up another record harvest in the fall.

3.30_ZS_carrout

The chart of the November 2015 Soybean contract exhibits a descending triangle. There is room for prices to rally toward $9.80 to $10 to fill out this triangle. The spike down on Tuesday after the planting intentions report no doubt trapped some short sellers. A rally will be needed to wear out the premature bears. Will prices play out as I have marked on the chart? Probably not, but it is something to watch for.

3.31_ZSX5_D

I have no desire to be short futures at this time. I will watching this market for a shorting opportunity. A decisive close below 940 would be such an opportunity.

Markets: $ZS_F, $ZM_F, $ZL_F


###

An update on Asian equities — upward explosion ahead


Factor LLC is a proprietary trading firm dating back to 1981 at the Chicago Board of Trade. Factor’s trading is based almost exclusively on the classical charting principles laid down in the 1930s and 1940s by Richard W. Schabacker, John Magee and Robert Edwards. Classical charting is an approach to market speculation based on the premise that certain geometric configurations, when plotted and identified on price charts, can produce possible outcomes. Factor LLC shares the research it conducts on futures, forex and global equity markets with individual and institutional investors via email communications. For more information on Factor’s research and trading services, please click the “Subscription” link on the menu bar.

The roar of the Asian Tiger is getting ever louder

The Asian stock indexes appear poised for substantial gains. Japan is leading the way, but stocks in Taiwan, Singapore and China appear ready to play some catch up.

3.22_Topix_M

The charts below are presented with only brief comments.

The Shanghai market is leading the way in China, as shown on the following graph.

3.22_Shanghai_M

Other charts of interest include iShares China Index ($FXI), Goggenheim China Technology ($CQQQ),  Global X China Financials ($CHIX) and the Hang Seng Index ($EWH, $HSIX).

3.22_FXI_M

3.22_CQQQ_W

3.22_CHIX_W

3.22_HangSeng_M

The Taiwan Futures Index ($EWT, $STW_F) has already flashed a major buy signal. The Singapore Futures Index ($EWS, $SSG_F) appears ready to attack the upper boundary of its congestion zone. A resolution of this trading zone would result on substantial advances in Singapore equities.


3.22_Singapore_M 3.22_Taiwan_M

In the world of chart analysis there is a ton of BS being peddled these days. The Factor is not. Try it … we think you will like it. See what the Factor had to say in January about global stock markets here.

###

A look at the Indian equities market


Bull market in Nifty 50 continues, selected stocks ready to buy, U.S. Dollar in trading range with Rupee

The Factor community has many Indian members. I am extremely impressed by the interest in capital markets within India. This interest is a reflection of all the reasons the Indian economy will continue to grow in the years ahead.

$USD/INR

The USD has been in a long-term bull trend against the Rupee (USD gaining on Rupee). The currency cross has remained in a trading range since mid 2013. This trading range is taking the form of an inverted continuation H&S pattern. While objects at rest tend to remain at rest (i.e., trading range), a decisive violation of 65.00 would be an indication that another phase of USD strength against the INR has begun.

3.19_INR_M

SGX Nifty 50

The Indian equities market, as measured by the Nifty 50, is in an historic bull trend. Our target on the Nifty 50 is 10,500. The market is experiencing a set back and consolidation on the daily graph.
3.19_Nifty50_M


Equities

The stocks below are presented without comment, other than to say they all appear to be preparing for a mark-up. Traders foreign to India should be aware that there is currency risk in owning individual equities. If at all possible, the Rupee should be hedged.

3.19_TV18BRDCST

3.19_SUZLON 3.19_SKSMICRO

3.19_MBECL

3.19_IDEA

3.19_ANANPOWER

3.19_welproj-march17


Thanks to Factor members S.S. and A.K. for keeping me posted on specific equities in India.


plb

$USD/INR, $NIFTY

###

Have Gold and Crude Oil bottomed — What do the long-term charts have to say?


History repeats itself — although most often with slightly different twists


Price graphs have provided strong clues to the direction of Gold and Crude Oil in recent years. So the question is — what’s next?


Crude Oil summary

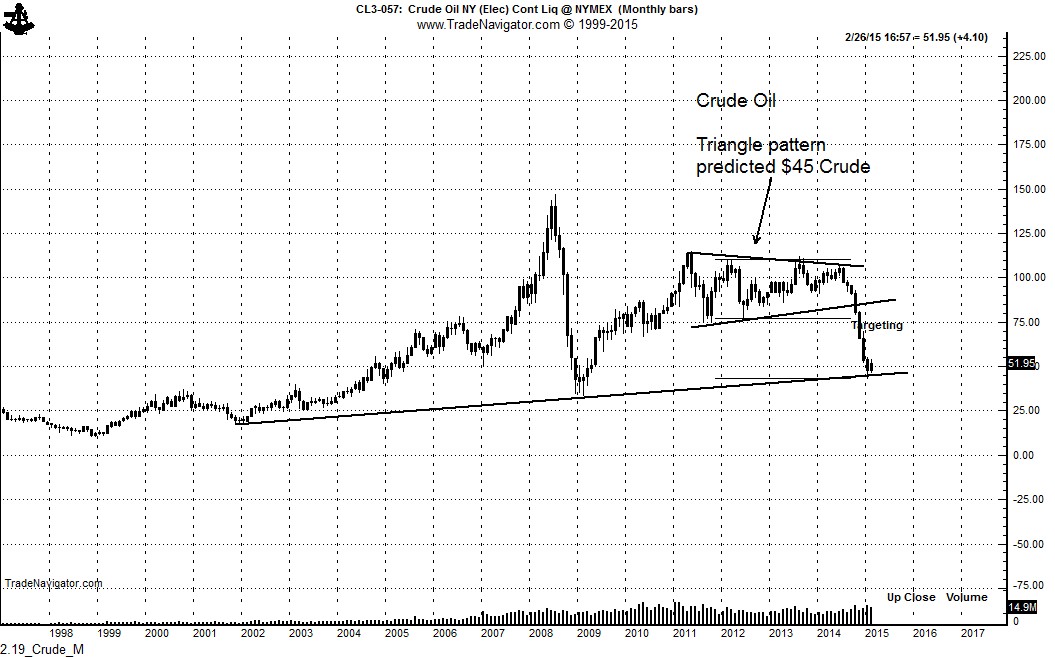
In August 2014 — with Crude Oil prices near $100 — this blog and the Factor email service began predicting a collapse in energy prices. This prediction was based on the formation of a symmetrical triangle pattern. We had been monitoring this triangle for more than a year.  Read our August 2014 analysis here.  The Factor initially projected a decline in Crude Oil to $65 — this target was then lowered to $45. Crude Oil producers scoffed at these forecasts. Crude Oil futures reached $44.20 on Jan 12, 2015.

2.19_Crude_M

The talking heads on CNBC and Bloomberg have now declared an end to the Crude Oil bear market. But, has Crude Oil bottomed? Should traders rush out and buy Crude Oil futures or related ETFs. I think not!

Let history be your guide.

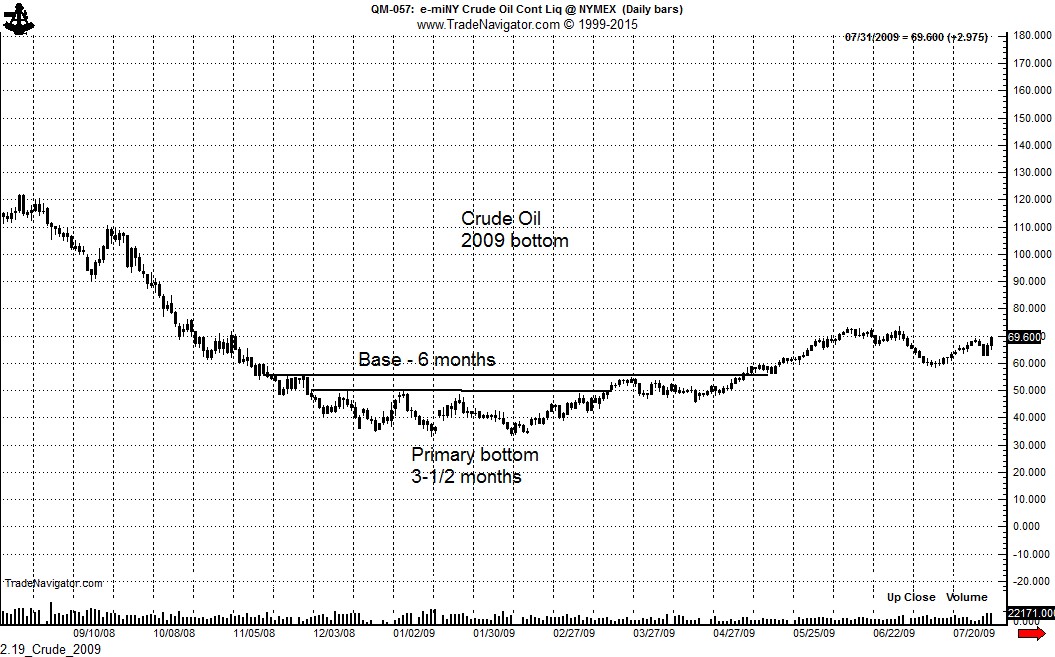
After the decline from $147 to $32.48 in 2008 (that’s right — a $114 decline), Crude Oil spent six months building a bottom on the nearby futures contract chart, as shown below. SIX MONTHS! The absolute low-to-date in this current Crude Oil bear trend occurred on Jan 29, only three weeks ago.

2.19_Crude_2009

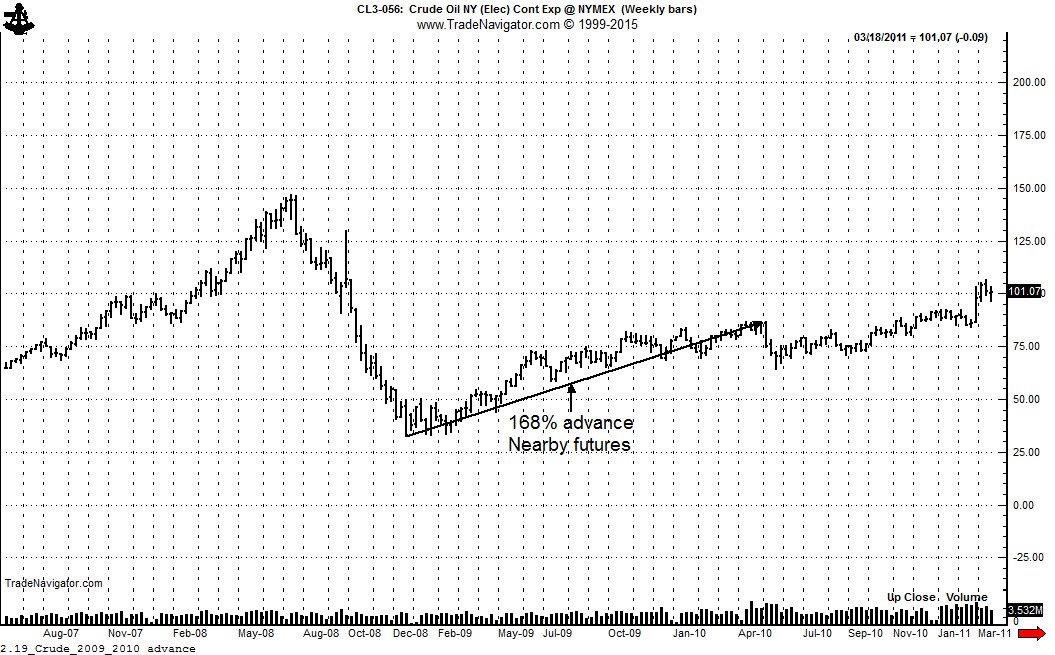
There is more to the story on why it is too early to become a Crude Oil bull. After the $114 decline in 2008, Crude Oil futures (nearby contract) advanced 168% from the Dec 19, 2008 low to the May 9, 2010 high, as shown below.

2.19_Crude_2009_2010 advance

Yet, enormous carrying charges developed during the 2008 decline. From Dec 19, 2008 (low for nearby Crude futures) through May 2010, the June 2010 Crude Oil futures advanced only 17% as shown below.

2.19_Crude_June2010


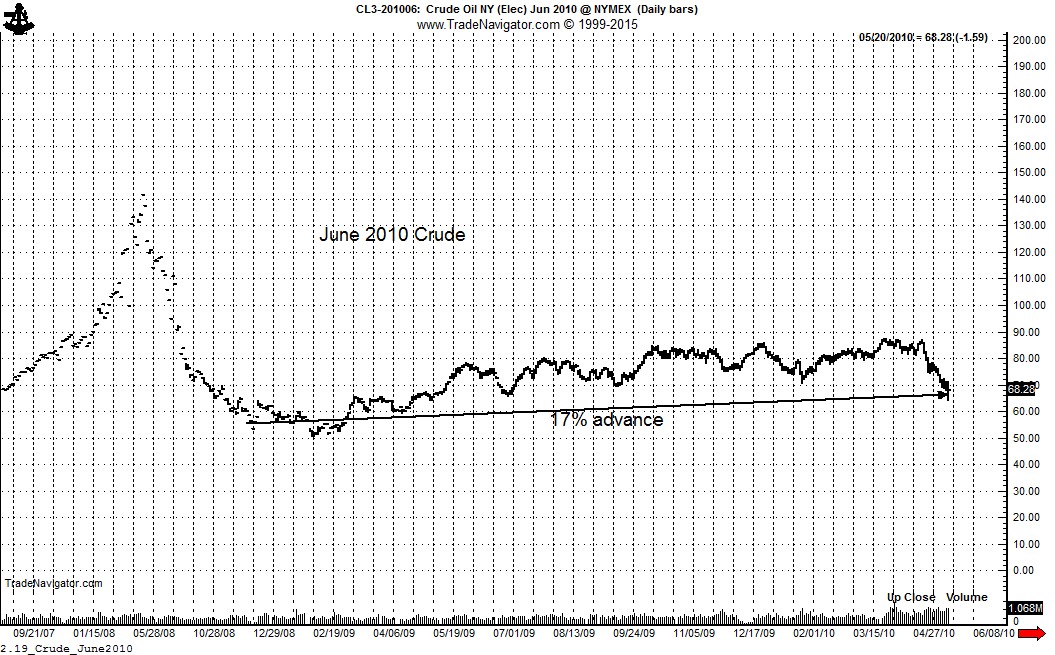
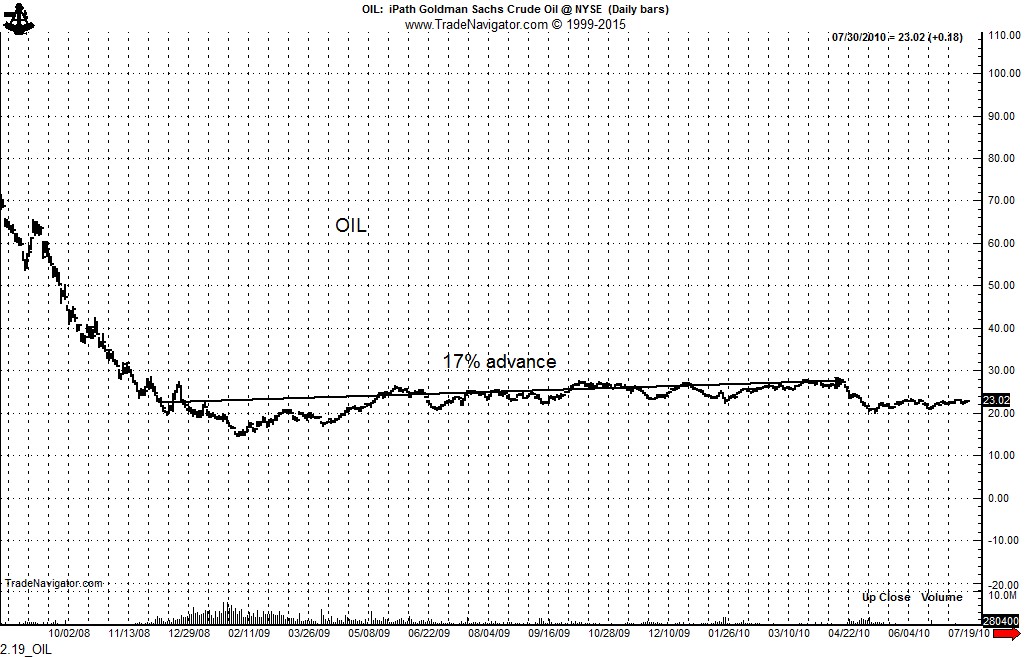
Crude Oil ETFs did not do any better. If a trader bought the ETF OIL on Dec 19, 2008, the day Crude Oil bottomed, and exited at the April 2010 high, the gain was the same 17%. Not exactly a trade to write home about.

2.19_OIL


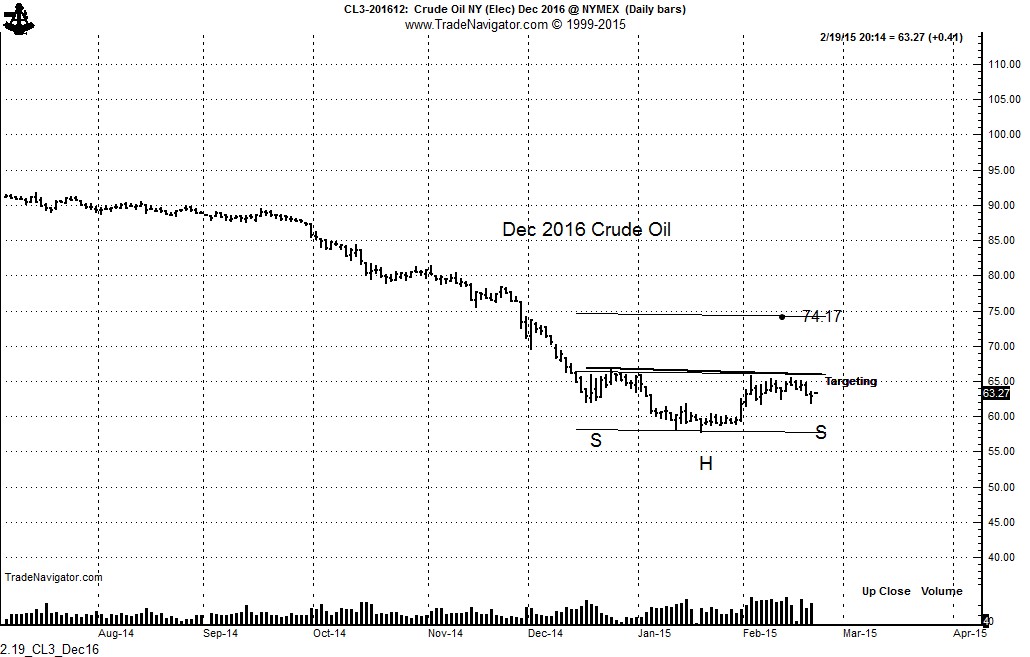
The current spread structure in Crude Oil futures has adopted the same profile as was the case at the 2008 low. The Dec 2016 futures closed today at 63.26, representing a 43% advance from the low made by the Feb 2015 contract. The frosting is off the cake. Worst case — Dec 2016 Crude Oil could decline to the mid $40’s as the market endures two to three years of depressed prices. Best shorter-term case — a rally by Dec 2016 Crude toward $70 could be a short sellers delight. Crude Oil prices fell a very long way in 2014, so a sharp snap-back rally is possible. As a classical chartist, I do note a possible H&S bottom in the Dec 2016 contract — so a rally toward $75 cannot be ruled out. But such a rally should be gobbled up by hedgers.

2.19_CL3_Dec16

Bottom line — spot Crude Oil may have bottomed, but making money on the long side will be for the quick and nimble. The deferred Crude Oil contracts have not yet seen their lows, although a dead-cat bounce could occur.


Gold summary

My perspective on Gold is unchanged. Gold is the ultimate charting market. The Gold market has always announced its intentions with the formation of a recognizable chart pattern. For background, please read the “Chart History of the Gold Market.”

The last major pattern in Gold was the 20-month descending triangle top completed in Apr 2013. The target of 1165 from this pattern has been met.

2.19_GC_W


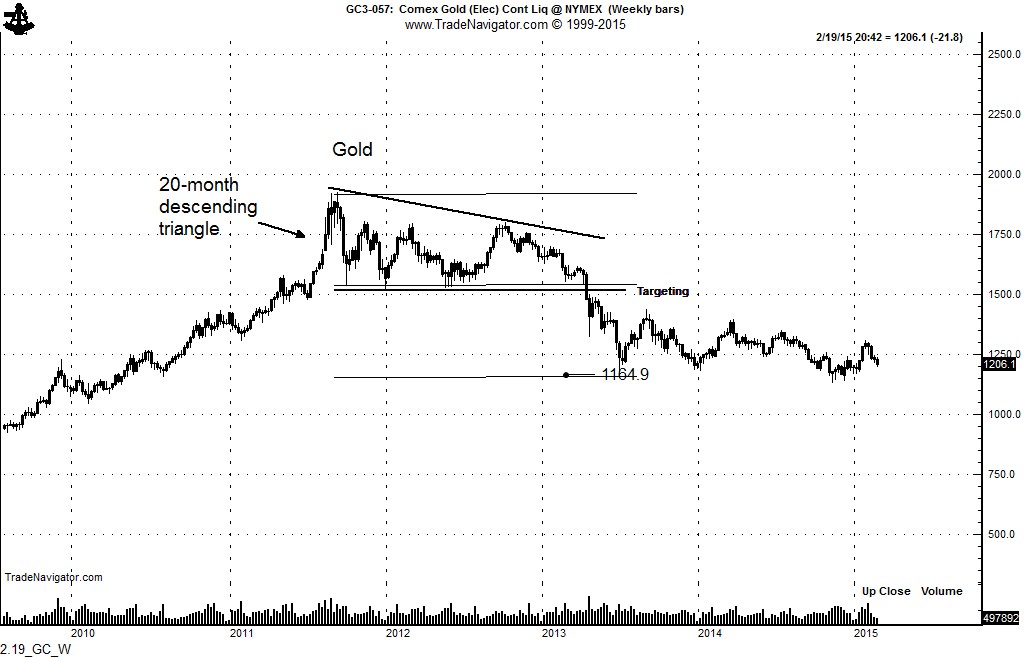
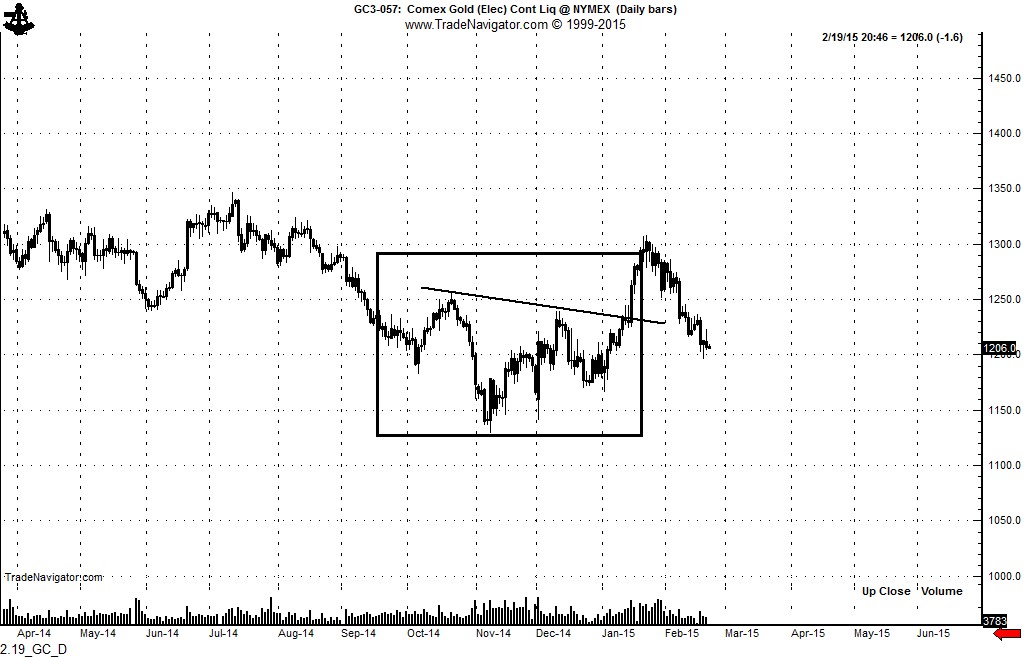
Yet, Gold has not developed a daily chart bottom — and I believe this is a necessary condition for any future bull market in the metal. I thought Gold had formed a H&S bottom in Jan 2015, but the recent decline has been too severe, so we are back to the drawing board. I see no trade in Gold at the present time.

2.19_GC_D


Markets: $OIL, $CL_F, $GC_F

Note: This post represents the type of technical analysis provided on a regular basis to members of the Factor service. Within the next few months the Factor service will impose a limit on the number of members — and an application process and waiting list will implemented. For more information on the Factor service, see the menu bar above.

###


Factor Edition of the Best Chart Patterns in 2014

Each year Factor LLC publishes what it considers to be the previous year’s best examples of classical charting principles. Here is the 2014 edition.

Factor brought a number of these chart situations in advance to the attention of members of the Factor email service. Click the appropriate link on the menu bar above if these type chart patterns interest you.

Cover 2014

###

European stock index advance stronly while U.S. markets facilate

If you want a bull trend, look to Europe (but hedge your currency risk)


While U.S. stock market indexes display extreme volatility, European indexes are arguably in strong bull markets with room to go.

The DAX is screaming into new all-time record high ground.

2.3_DAX_D


The DJ Euro STOXX 50 has also broken into new highs for the current advance, although new all-time highs are some distance away. Nevertheless, the momentum is clearly for higher prices. I am looking for a low risk entry point in futures — and that might be the resolution of the tight flag currently forming.

2.3_ESTX50

Of most interest to me as a chartist is the FTSE 100. The quarterly chart displays a 15-year consolidation zone. The FTSE has been hugging the upper boundary of this zone for the past 20 months, as shown by the weekly graph. It could be that the Index is prepared to breakout of this trading range. If so, look for a strong bull trend from the U.K.

2.3_FTSE_Q

2.3_FTSE_W

Remember, there is currency risk in European markets. If the DAX advances by 15% but the EuroFX declines by 15% if would be a scratch trade. U.S. traders of the European futures indexes would only have currency risk on margin capital But, traders of U.S. ETFs should hedge the value of their purchases.


Markets: $DAX, $Z. $FTSE, $ESTX50

###

See what I said about Crude Oil on August 11, 2014


As early as June I began pounding the drums for a major decline in energy prices. In early November my Crude Oil price target became $45.

Remember, broken clocks are right twice each day. When I am right, I am often right BIG. When I am wrong, same thing.


[scribd id=251871058 key=key-tU9O5vWRe1qCKxPiQH4l mode=scroll]


###