Chart of the Day — with a Hearty Hi-Ho Silver Away
Silver could be experiencing a serious technical breakdown
And with it, Silver bulls might experience a serious emotional breakdown
Whenever a market makes a new high or low for a move, a technical trader must ask him or her self the following question:
“Is this price movement a blow-off, to be followed by a reversal, or is this price movement a sign of another leg of the dominant trend?”
Let’s review the Silver charts.
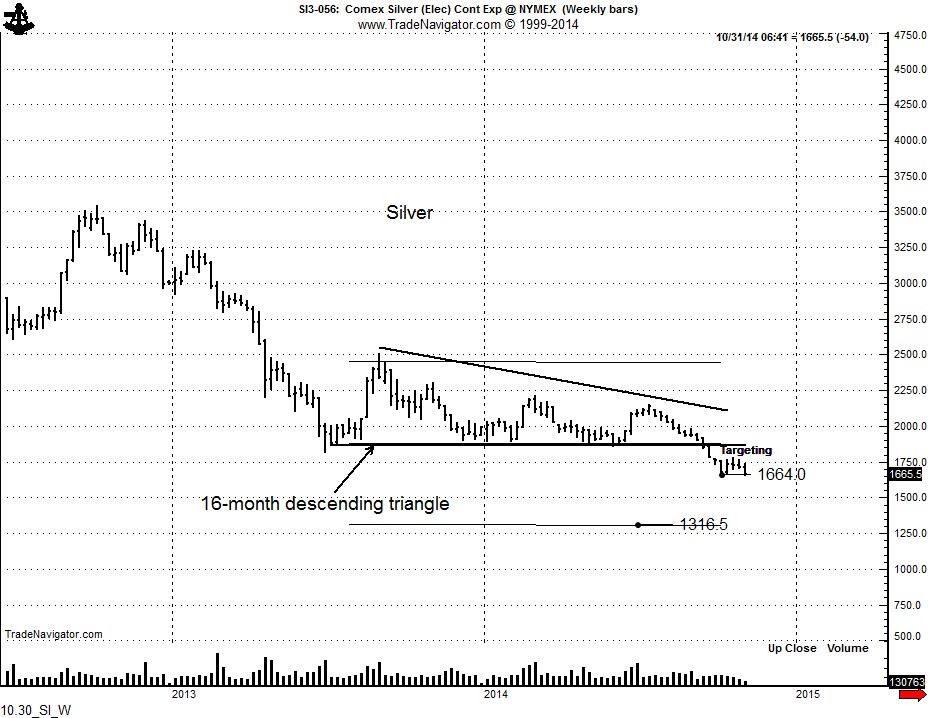
The decline in mid September completed a 16-month descending triangle pattern on the weekly chart. This pattern implied an eventual decline by Silver to 13.16 or so.
The market bottomed on October 3 and began a mild and dull 3-week rally that took the form of a small rounding pattern or flag on the daily graph. The strong decline today — IF IT FOLLOWS THROUGH — would be an indication that the market will trend steadily to the 13.16 target.
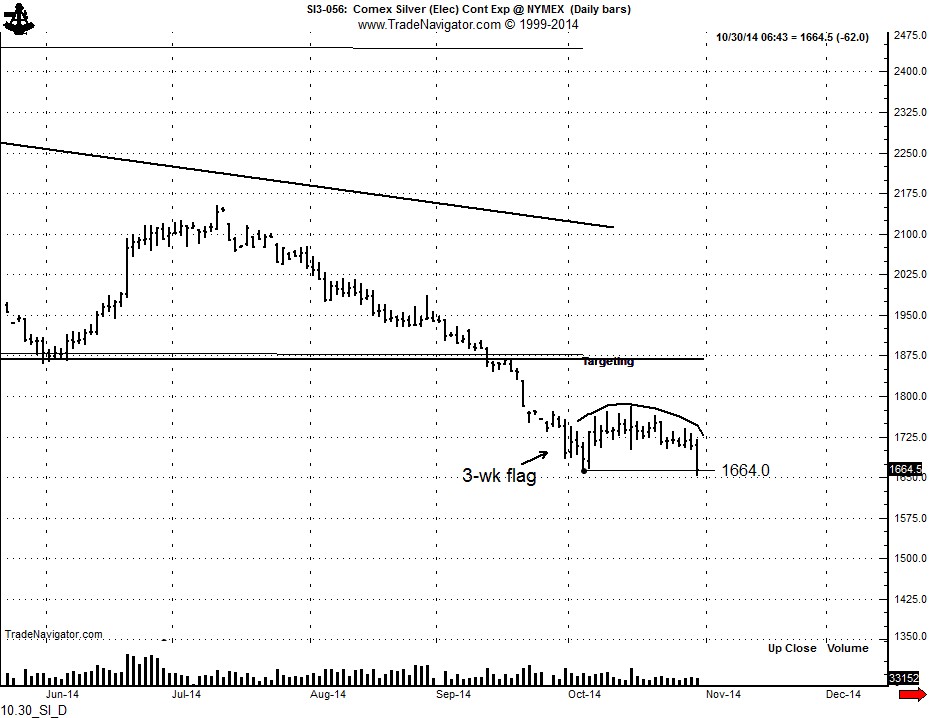
Shorts must realize that a breach of the October 30 high, and even more so, the October high, would place the interpretation into doubt.
$SLV $SI_F
###


Leave a Reply
Want to join the discussion?Feel free to contribute!