Major congestion zone in Japanese stock indexes are being completed — path of least resistance is sharply higher
The advance during November in the Japanese stock market completed major consolidation zones on the charts for the Topix and Nikkei Dow indexes.
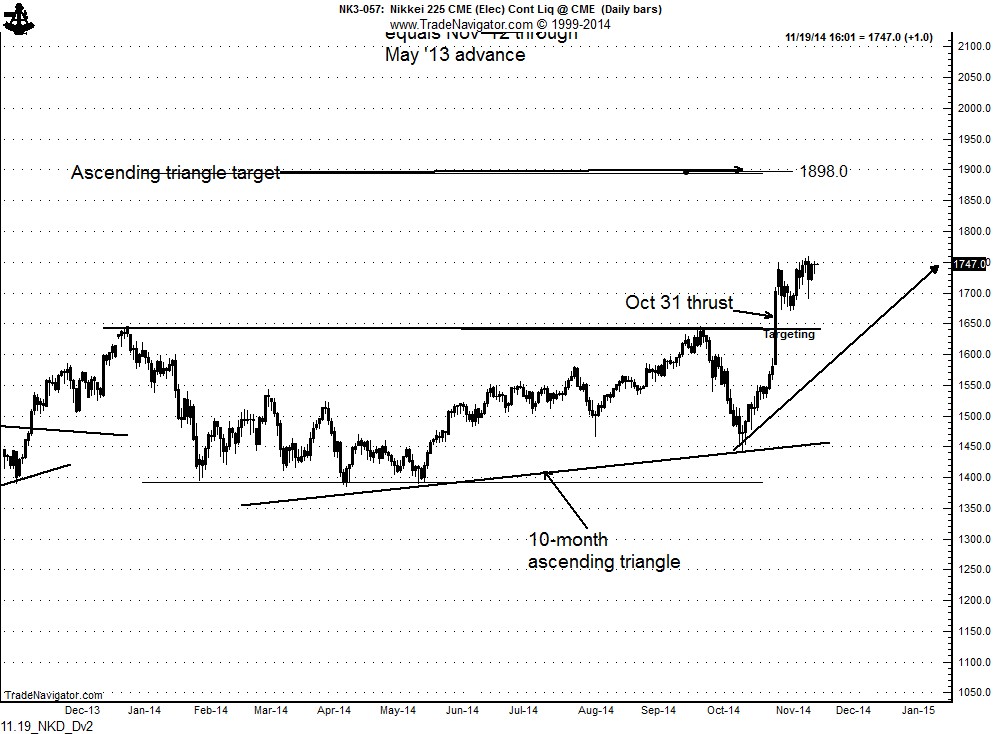
The weekly and daily charts of the Nikkei Dow (U.S. Dollar-denominated) completed a 12-month ascending triangle configuration with the huge thrust advance on Oct 31. Massive advances such as this display urgency on the part of buyers. That this thrust completed the year-long consolidation and little correction has occurred show that the market has powerful underlying forces.
The target of the ascending triangle on the Nikkei weekly graph is 1898, a mere 8.7% above current levels. However, my view is that the period since the May 2013 represents a “half-way” pause in the bull trend that began in Nov 2012. As such, the advance from the Oct 2014 low to the eventual high should equal the advance from the Jun 2012 low to the May 2013 high. This establishes a target of 2170, a 24.7% advance from current levels. If the “angle of attack” of the current advance equals the “angle of attack” of the first bull phase, the target should be reached by mid-2015.
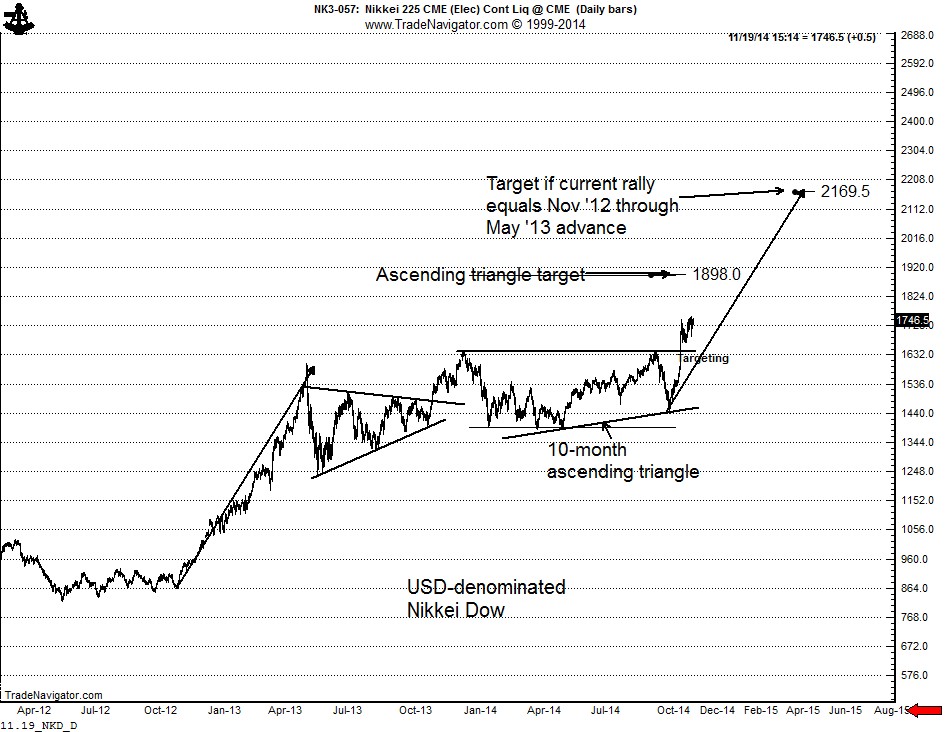
Is there any collaborating evidence for a 25% advance from current levels? YES INDEED!!!!
The quarterly chart below is the Japan Topix Index. As this chart displays, the Topix has been in a broad trading range dating back to the 1993 high. This high has been repeatedly tested. Viewing the May 2013 through Oct 2014 ascending triangle on the weekly Topix chart as a “half-mast” consolidation, the target becomes 1750, a price in line with the broad 21-year trading range.

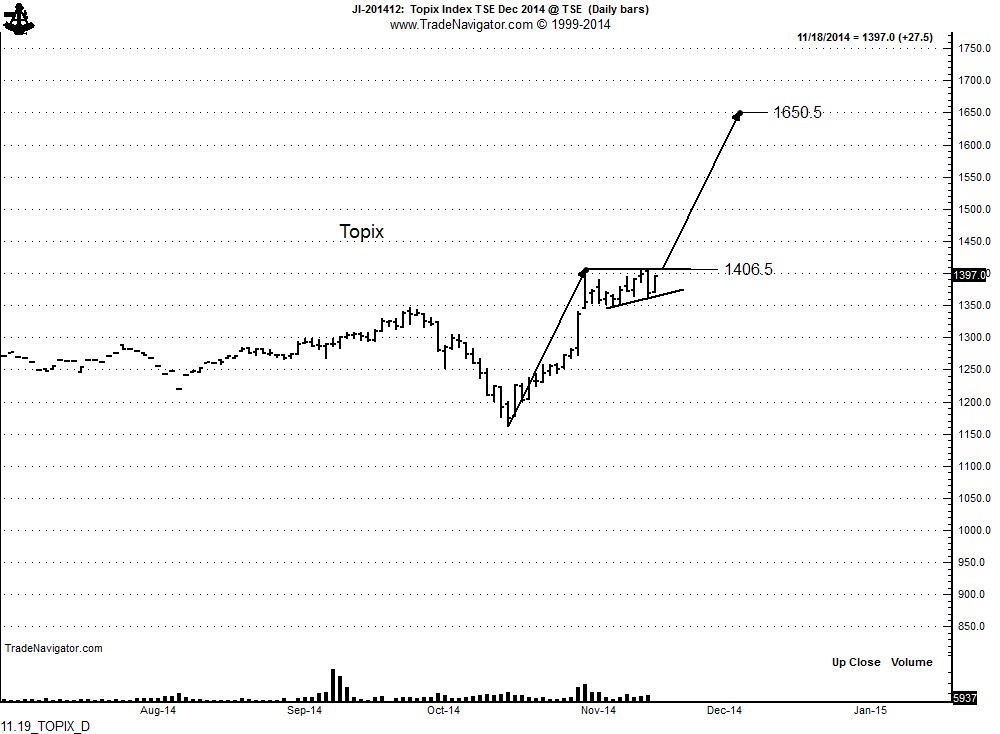
I am always hesitant to comment on shorter-term patterns such as those found on daily or intraday charts because they are much more likely to morph. Yet, I will make a passing comment on the daily chart of the Japanese stock market because it might provide timing for the next leg up in this bull move. The daily Topix chart (Dec futures and spot) is forming a tight 12-day pennant. The following quotes are from the book, “Technical Analysis of Stock Trends,” John Magee and Robert Edwards, 1948. TAST is [incorrectly] considered to be the bible of classical charting principles.
“It [Pennant] forms as a rule after a rapid advance”
“There are rarer minor variations of the Pennant … in which the slope is actually slightly in the same direction as the preceding trend.”
“They [pennants] are ‘half mast’ patterns which ordinarily form after a fairly steady and rapid (steep) price movement. In applying the measuring rule, go back to the beginning of that immediately preceding move, to the point where it broke away from a previous Consolidation, a point recognizable as a rule by a quick spurt in activity, and measure from there to the Minor reversal level at which the Pennant started to form. Then measure the same distance from the point where prices break out of the Pennant, and in the same direction.”
Based on the last bullet point, if the Topix is forming a pennant, the target will be 1650 as shown below.
Disclosure: Long Nikkei Dow (Osaka), long Topix (Osaka)
plb
$DXJ, $TOPIX, $EWJ
###
[Note to first time readers of this blog: This analysis represents the type of thinking that members of the Factor receive on a regular basis via email.]
Note to you macro economic gurus who consider charting to be a form of voodoo: I am glad you think this way. Keep thinking this way. You probably still believe in random walk theory. If so, you are wanted on the telephone. The last century is calling.