Next leg of Euro Currency bull trend against the British Pound begins


British Pound could drop significantly against the Euro

The Euro Currency Unit was first created in March 1979 as an accounting currency intended to stabilize exchange rates within Europe (although the idea of a central currency unit within Europe dates back to the 1930s). Officially the Euro Currency was born in January 1999. Great Britain has never joined the EU currency mechanism and thus the British Pound has floated against the Euro.

At its formal inception on January 1, 1999, the Euro traded at .7069 Euros per GBP.  After bottoming at .5683 in 2000, Euros have been in a 13-year bull trend against the Pound. The charts would indicate that the Euro is embarking on another up leg against the Pound.

The monthly chart displays a 55-month falling wedge pattern. The dashed line represents the Friday closes. The forex cross is attempting to punch through the upper resistance boundaries.

7.16_EURGBP_monthly

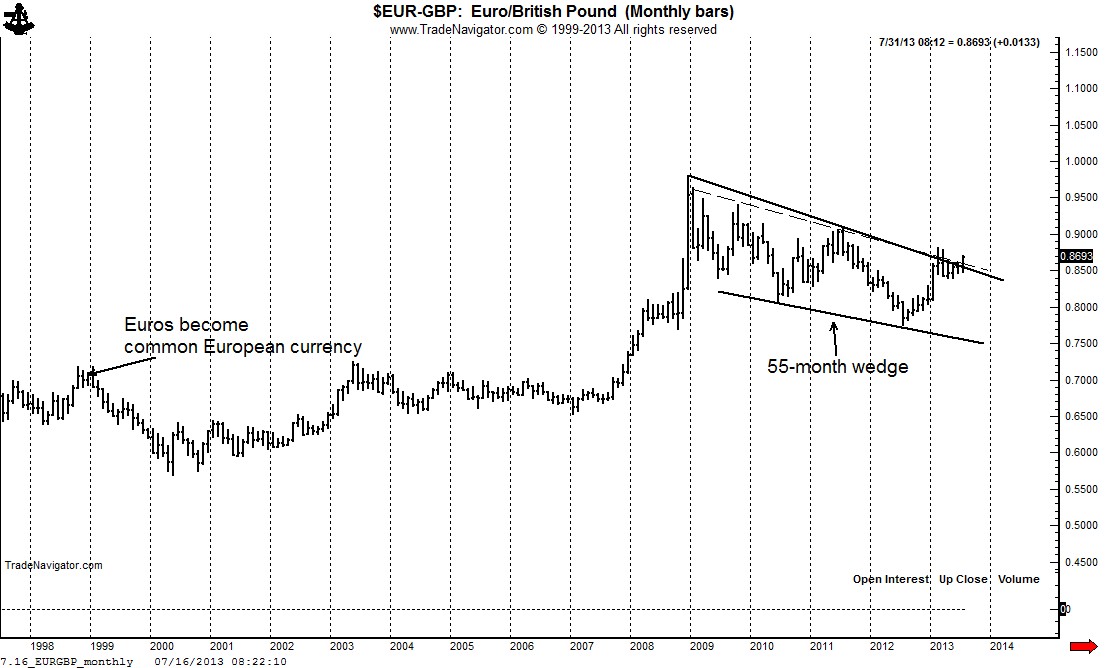
The daily chart below shows in more detail the current attempt to breakout of a multi-year consolidation.  The advance on July 4 completed a 3-month triangle. The market has now cleared the boundary from the monthly orthodox highs (solid line) and the weekly closing prices (dashed line). EURGBP should work its way to .9600 in the months ahead.  A close under .8550 negates this analysis.
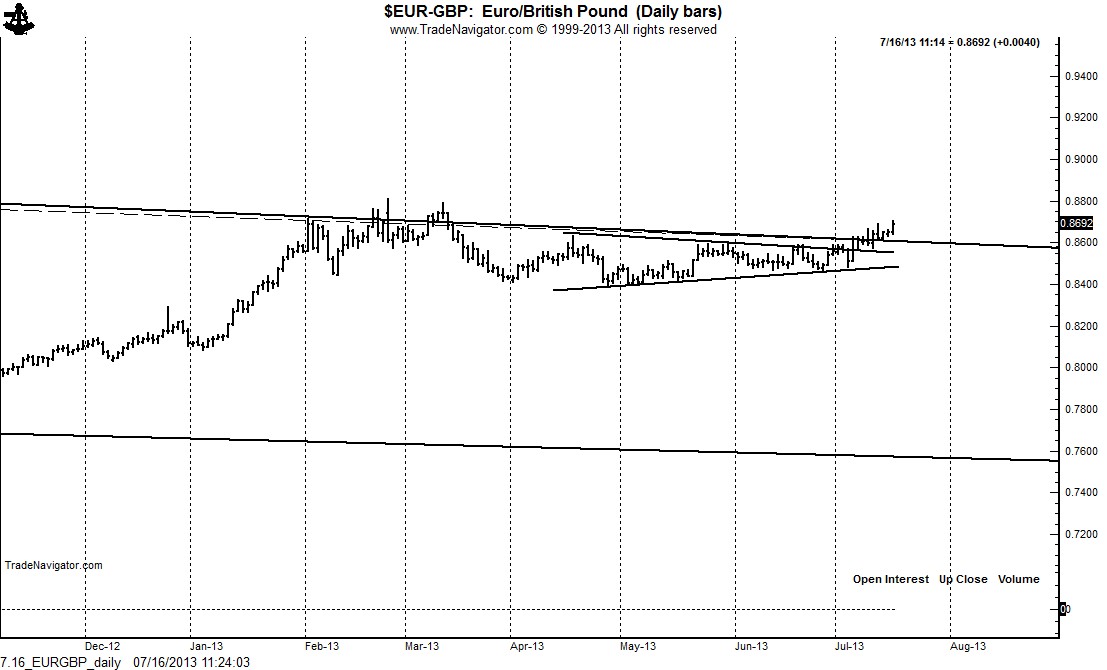
7.16_EURGBP_daily


$EURGBP


An anatomy of a bear market – looking at Silver with classical charting principles


The decline in Silver has been a textbook example of classical chart principles

The bear market in Silver actually started during the blow off in April 2011. See blog post calling the top here.

The retest rally into the Aug. 2011 high fell way short of the top and a failure top was confirmed in Sept. 2011.

The weekly chart then formed an 18-month continuation H&S pattern. Elliott Wave technicians deny that this classical pattern exists. Edwards, Magee and Schabacker — the fathers of classical charting — all discussed this pattern. Elliott Wavers need to stick with wave counts and leave classical chart identification to classical chartists.

The decline in April 2013 competed the continuation H&S and established a target of the mid 1700s and then the high 1600s.

7.10_Silver_weekly

The daily chart displays several classical chart developments. First, a 5-month horn top was completed in mid Feb. This was immediately followed by a 5-week pennant that broke down on Apr. 1. An 8-week descending triangle formed following the sharp decline of Apr. 15. [A lesson on classical charting: Note that  my lower boundary is drawn through the May 20 low. The May 20 decline is called an “out-of-line” movement. Pattern boundaries need to be drawn to best describe price congestion.

7.10_Silver_daily

The market remains in a strong bear trend. This bear trend will remain fully in force as long as the moving averages remain down — I use a 14-bar MA. Note that this MA has been down for 21-straight weeks. The market is now forming what could become either a flag or pennant.

7.10_Silver_Sept

I hope a review of these charts demonstrate why I could care less about the nonsense of inflation, supply shortages, fiat currency concerns, and such nonsense. Price rules!!!

$SI_F, $SLV, $PHYS


Massive triangle in Pound should lead to 1.3500


Targets of 4+ year symmetrical triangle are 1.4230 and 1.3502

7.5_GBP_monthly

$GBPUSD, $6B_F


###